

A Look at Equity and FI Flows
A Look at Equity and FI Flows
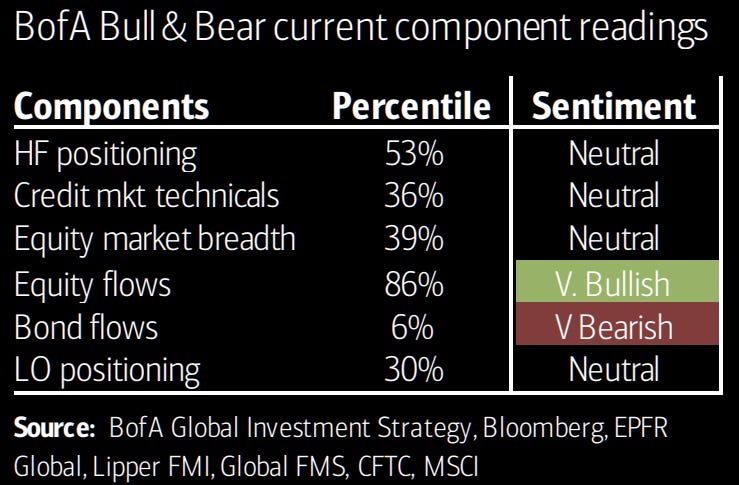
Equity Flows: Very Bullish, Current Sentiment: Neutral (3.9)

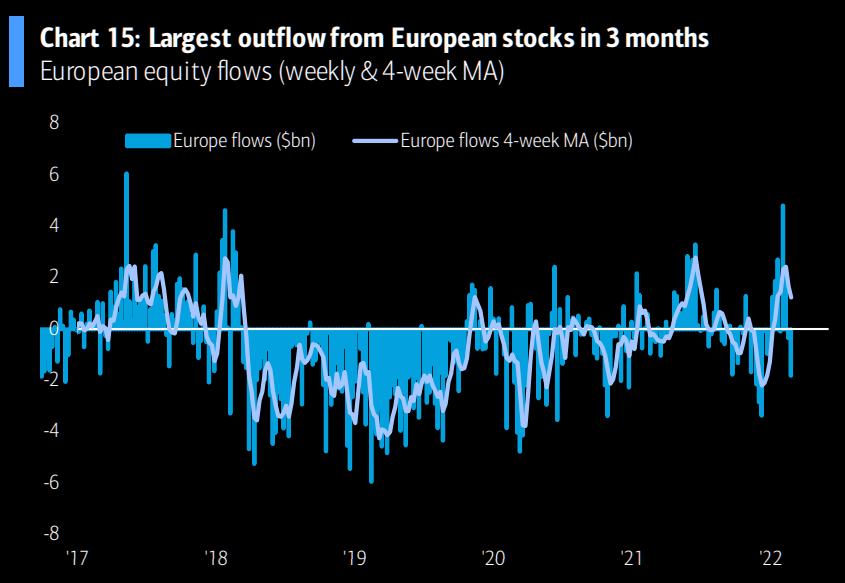
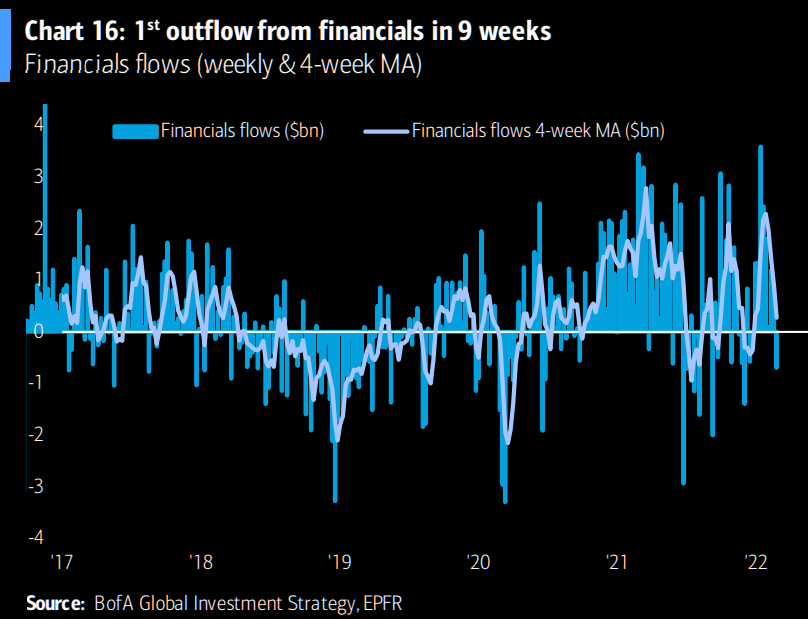
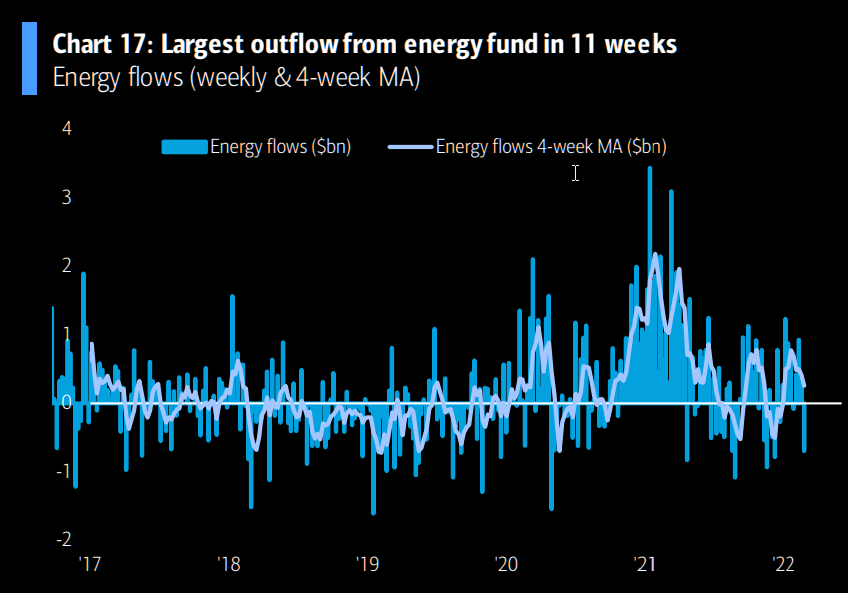
A 7th consecutive week of redemptions from IG+HY+EM debt ($5.2bn); the largest outflow from European stocks in 3 months ($1.8bn); 1st outflow from financials in 9 weeks ($0.7bn); largest outflow from energy funds in 11 weeks.
$7bn to cash, $6.2bn to equities, $0.6bn to gold, $3.5bn FROM bonds.
Bear Market?

With geopolitics and “growth shocks” contributing to the 2022 inflation march, commodities up 40%, stocks down -6%, cash -7%, and bonds a staggering -15% in real terms (adjusted for 12m rolling inflation numbers), market participants have become increasingly bearish.
An incredible 76% of Nasdaq stocks are trading -20% or more from their highs. For the S&P, that number is 51%, and 35% of ACWI issues are in bear market territory. 47% of Nasdaq constituents are down over 50%, with Disney, Netflix, Meta, PayPal, biotech firms, and ARK at or below their pre-covid levels.

Real interest rates are at an astonishingly low level, particularly when inflation is taken into account. The real rate on the US10y treasury is at levels only seen during prior panics, wars, and crashes. That said, there is a war, and the market does seem to be panicking.

However, when adjusted for global yields, rate spreads for US vs. ex-US sovereigns aren’t out of line with historic levels for developed markets.

Inflation, Stagflation, and Secular Bear Markets
Some economists and analysts have called for a secular bear market, with tech stocks already in a bear market, increasing government intervention, geopolitical tensions, social conflict, inflation, and rising isolationism. While the bullish low-rate low-inflation environment of the 2010’s is over, we could see a highly unpredictable environment for economies and capital markets.

While we’ve witnessed sustained inflows into equities, price action over the past 7 weeks has been downward. BofA has published quite a few bearish pieces recently, particularly leading up to this past Thursday, which saw two consecutive days of significant gains for the market.
The 1970’s were our last real secular bear market with inflationary pressure, and we can look for examples in history to inform our decision moving forward. Proper diversification across entire portfolios is incredibly important. If history “rhymes”, then we should be bullish value, small cap/value equity, REITs, commodities, energy, and TIPS.

For the years of 1973-1974, where there was serious stagflation, only commodities and copper outpaced inflation.
Russian-Ukrainian War
Thursday and Friday saw a good amount of short-covering, which could be part of the old adage, “buy on the sound of cannons, sell at the sound of the bugle”, we saw short-covering, inflows, and puts being cashed out. The invasion in Ukraine is a serious matter, and certainly should have large net negative effects on global equities, including higher inflation and the potential for central bank tightening.
As always, war invites serious policy blunders as well as errors from the Fed, and even shifts in political discourse/climate and representation. If you’re into politics, it’s more likely than ever that your vote will be needed (and asked for often). Policy mistakes and potential rates shocks could result in recession, noted BofA in a recent letter to clients.
Prior Conflicts and Equity Returns

During prior conflicts, markets sold off between -1% and -17%, but only took 6 to 27 days to recover. On average, the S&P fell -7%, rates rose 16bps (this was primarily during the Iranian hostage crisis, however, with a net negative rates effect during all other crises). We’ve also seen surges in oil prices during conflicts where supplies are involved.
Nasdaq Oversold? Commodities Overbought?
Are there reasons to be bullish? Perhaps so.
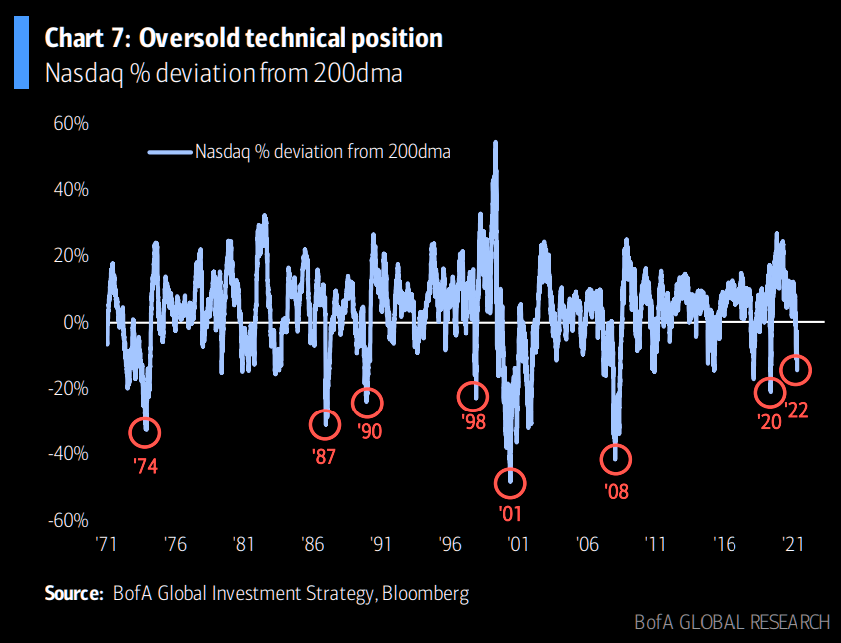
The Nasdaq is currently oversold from a technical point of view, with Nasdaq trading 15% below its 200dma. The Nasdaq almost never trades more than 15-20% below its 200dma in the 2020’s. There have only been a few exceptions: March 2020, the GFC, and the dot-com crash in 2001.
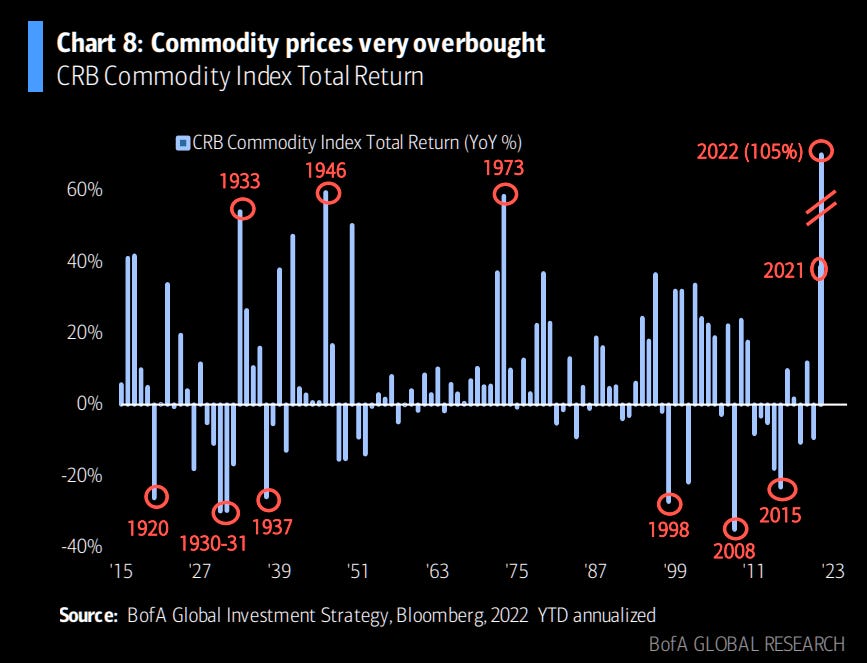
Commodities have responded inversely, and appear extremely overbought with the CRB commodity TR index reaching +105% yoy after a wild 2021. This is, by far, the highest return from commodities since at least 1915, per the above chart.
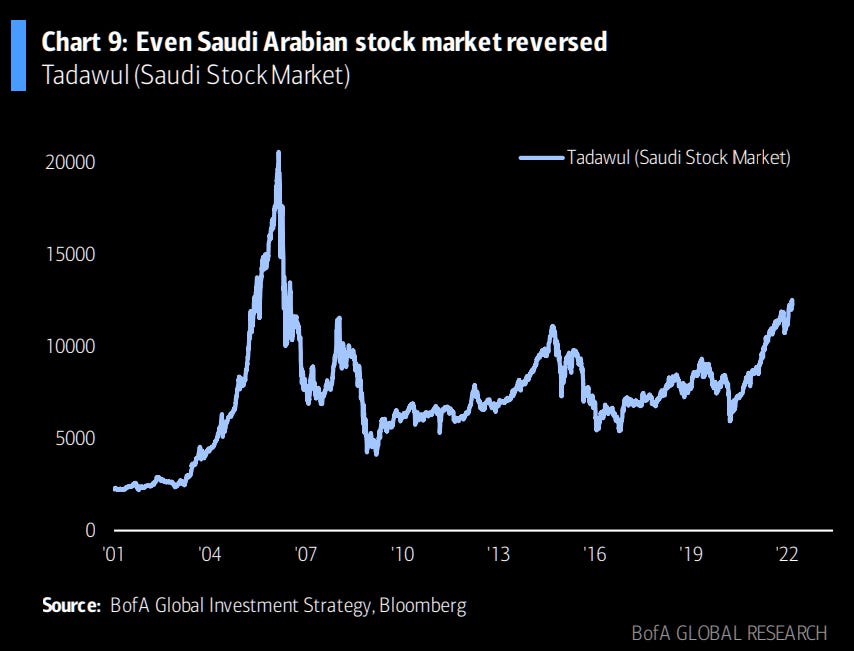
Oil, wheat, corn moved higher again, but their equity counterparts did not seem to notice. BofA notes that “even the Tadawul reversed”, and that oil prices may be signalling potential damage to demand, “setting the stage for peak inflation”.
From the outset of war, Fed rate hike expectations calmed down, and the Nasdaq gained 3% on Thursday as Russia invaded Ukraine.
Equities have been hit especially hard in 2022, with duration, growth, tech, and emerging markets already experiencing a bear market. The Nasdaq remains oversold, despite lessening expectations of a hawkish Fed.
It’s not immediately apparent to me that the Fed will (or can) raise rates 7+ times in rapid succession, as is being suggested by “economic experts”. Personally, I do not believe the Fed needs to sell any assets, ever. They may begin to tape, and they are likely to raise rates, but I feel that 7 rate hikes is excessive in a world of negative-yielding debt. Japan has successfully socialized much of their debt, and despite fierce competition in imports/exports from neighbors, along with an aging population, the Japanese have fared quite well.
The TOPIX/Nikkei have routinely returned more than the S&P, although in recent weeks, the S&P has finally caught up, but only without dividend reinvestment. You can read more blow in the Japan Macro Rundown:

Bearish Indicators
So, what would look bearish at this point? We’ve already traded down quite a lot this year, although we’ve recouped a good portion of those losses in the past couple of trading days.
For positioning, there will, inevitably be a re-entry into equities for bears. Markets always drift upward over time, and have positive real returns (above inflation) during even their worst 30-year rolling periods. This is true for every period in recorded history, going back to at least the early 1800’s, and possibly the 1600’s, depending on which studies are used. This has not been the case for fixed income.
I went over BofA’s private client allocations/flows last week, which you can read here:
However, recent inflows and data on private client asset allocations indicate that bearish sentiment has not peaked, and as such, the “point of re-entry” for bears, where there’s no more bearishness left to be had, has not been reached.

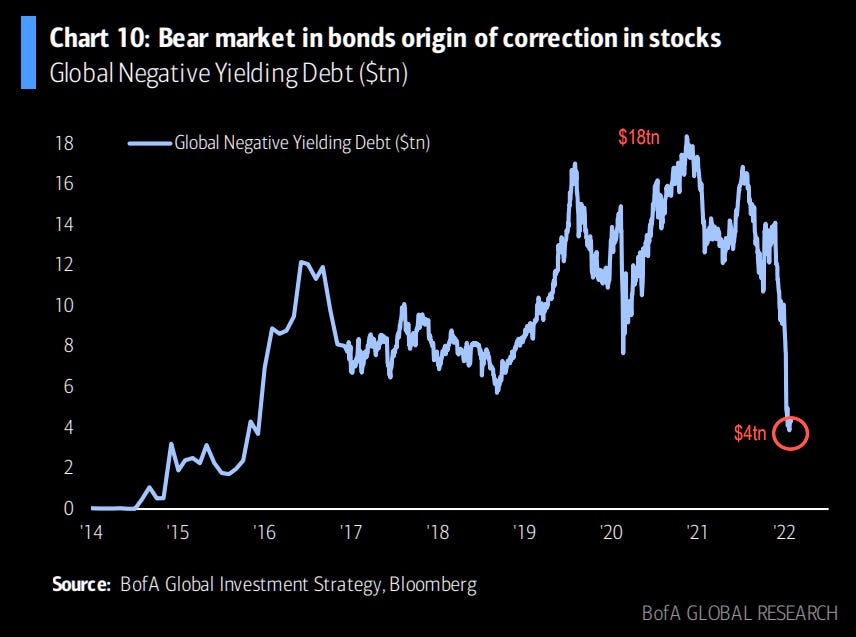
Corporate bonds have experienced continued selling pressure, and a bear market for bonds has seemed to trigger waves of equity selling. There has been a sell-off in negative yielding debt, which has shrunk to $4tn since January 2021 (from $18tn).
The risk of cyber blowback in the face of Russian sanctions poses a threat to supply chains should a cyber attack target bottlenecks or otherwise targets utility infrastructure. If SWIFT sanctions pass, this should have an effect on capital flows, volatility. All this could result in further deleveraging and asset price declines. Coupled with the potential of decreased consumer confidence and business projections, this would lead to the new Equity boy-band: “Growth Shock”.
But wait, there’s more!

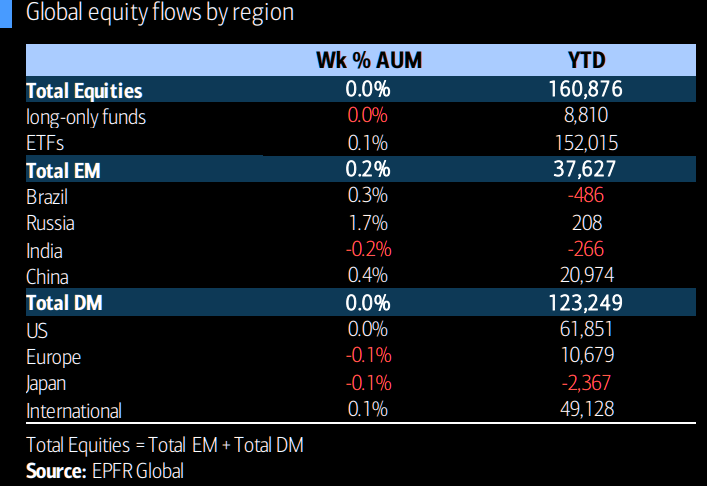
Net fund flows to DM easily outpacing EM

BofA is gonna sue me. Enjoy it while it lasts.
BofA private client flows & allocations
Oops… BofA did it again! I just want to raid Britney’s closet.
She can keep her makeup. Her outfits are mine, though.
Ahem. “Private” clients (aka “Praying for IPO placement from BoDaddy”) must enjoy having their allocations and flows given out. Who cares. Let’s look!
GWIM Flows Have Favored Bank Loans, Growth, Munis:

GWIM Equity Allocation at 64.2%
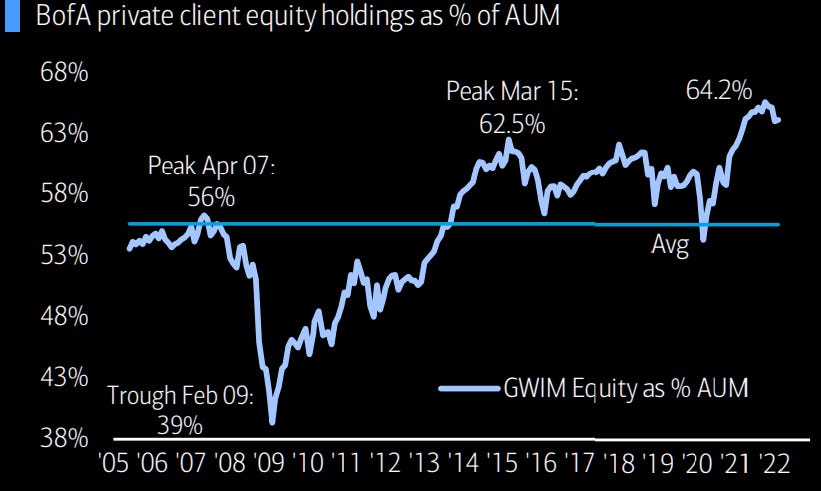
As you can see, this is pretty normal for BofA’s private clients. They’re pretty awful at maintaining adequate equity exposure. Perhaps they’re ultra-rich. They generally earn returns equivalent to 1/4 the return of the S&P 500.
Either way, it’s interesting to look at their decisions. (Maybe don’t go to 39% exposure at a multi-decade low point, though?) I assume they’ve signed up for BofA’s hilariously awful AM arm for the perks: IPO placement, a plastic 2FA authenticator and generally getting their eyes gouged out and face ripped off by coked-up 25 year-old “bankers” with a half-finished “hoagie” on their desk. Kind of like the travelling circus of banks. But that’s just my opinion, I could be wrong! These guys still wear clip-on ties and ride the subway, after all.
GWIM Debt Allocation at 17.3%
As a percentage of AUM, BofA clients are holding a record-low amount of debt. Did somebody tell these guys that equities return more than bonds, even during inflation? I doubt it.

The brain geniuses have deposited 11.6% of their assets as cash, only to leave it sitting in cash. Awesome job, BofA advisors! Who needs a Schwab robo-advisor to steal 6% in cash when your clients are maintaining at least an 11% position in trash? Maybe I should add to my $BAC position, they must be really raking it in.
GWIM ETF Holdings Continue to Rise as % AUM

Debt vs. Equity ETF holdings as a percentage of AUM is currently tied. Equities are winning anyway. This is primarily attributable to the fact that debt has such limited risk, that it’s barely worth investing in. Okay, maybe they’re retirees avoiding sequencing risk? I dunno, but I’ll never put 16% into debt/credit until I’m 65+.
MOVING ALONG!
GWIM Top Ten Issues for 1-year SPX beta:

Ranked Cross-Asset Returns 2000-2022 (updated February 25):
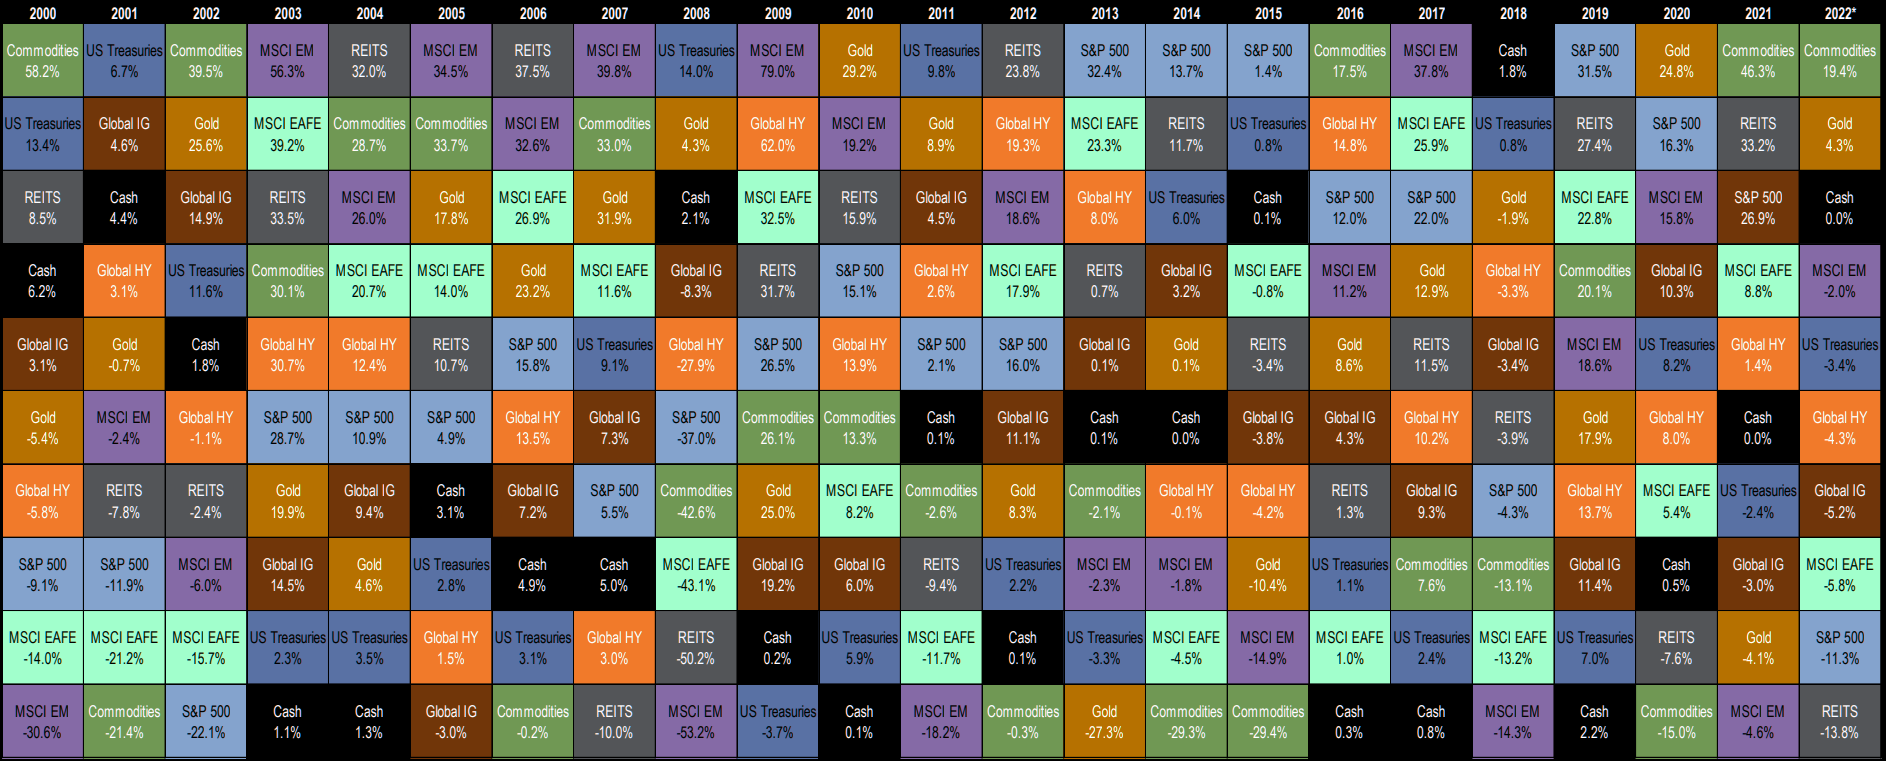
Updated from last week’s return tables, it looks like commodities have been the biggest winner of the 2000’s. This begs the question, particularly as commodities enter overbought territory: what will be next?
Despite the bearish sentiment lately, I expect MSCI EAFE/EM and international stocks to do well along with LATAM stocks. The S&P 500 should remain strong as inflows continue, but fundamentals are more supportive internationally, as CBs remain more dovish outside the US. Gold appears overbought after a stellar run, and future returns should be muted or negative, and investors are likely to sell gold and buy the short end of the curve. Should losses hit the bizarrely popular lump of metal that produces nothing whatsoever, this should lift the bid on ultra-short treasuries, followed by inflows into the short end.
Pensions remain fully-funded and continue to sit on the long end of the curve, with 20y rates surpassing 30y rates. This stuff is automatic and mechanical (afternoon 30y buys) and pensions don’t particularly care about real returns, as they’re more concerned with meeting nominal redemptions after spending decades under-funded.
As for the near term, the S&P 500 could display outperformance against international markets, barring a reloading of short positions next week, which would likely hit large-cap growth/tech stocks again. Value should hold up well, along with SMidcaps. A properly diversified portfolios should be able to function on autopilot—if they aren’t already.
Whether it’s simply holding $VT or $ACWI or $VTWAX (or a low-fee [>0.2%] target-date fund), diversified portfolios should benefit more than ever from international exposure and DCAing/rebalancing into fixed income. I recommend a 2/3/4-fund solution, where you can set your own US/DM/EM/FI balance suitable to your risk appetite, age, and expected return path.
THERE’S STILL MORE!
Overbought and Oversold
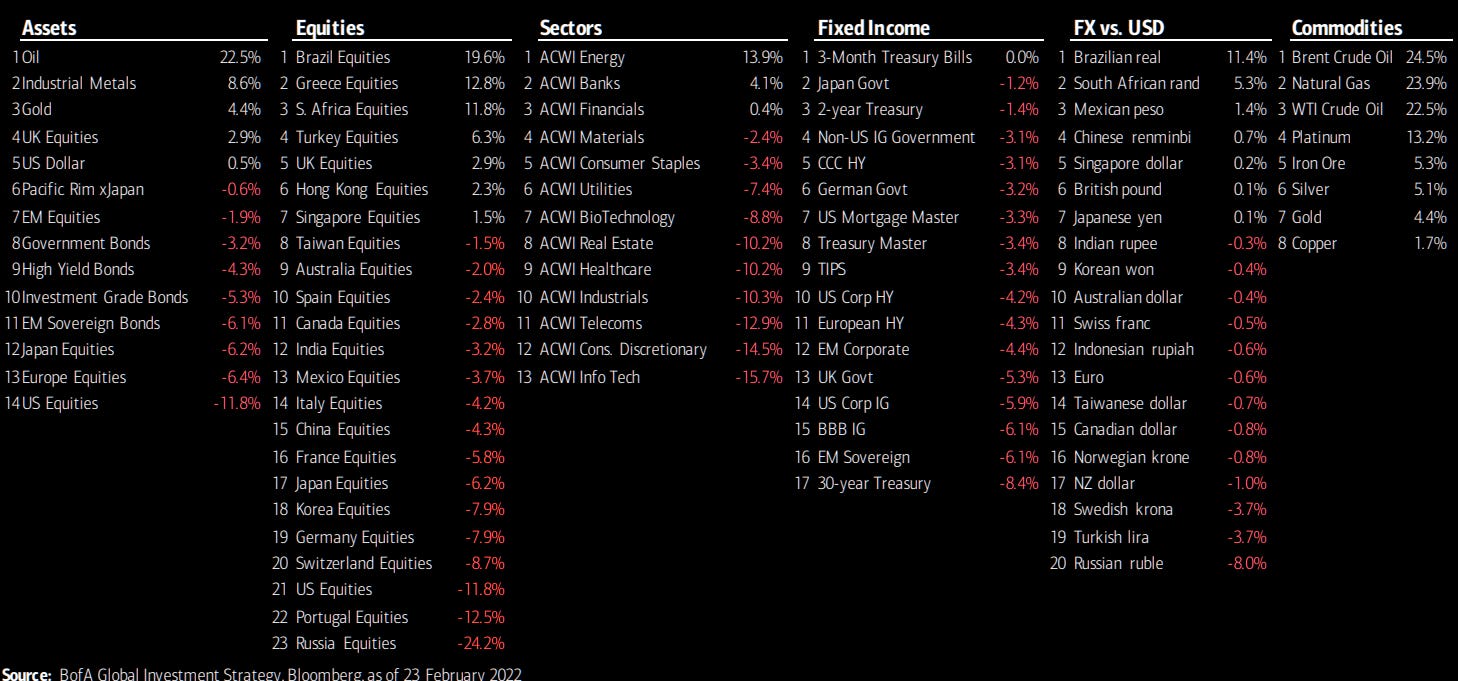
(Rankings based on deviations from 200dma in USD terms only)
Oil, Greek/South African/UK/Brazilian/Taiwanese equities leading. Energy is leading global sector indices, with banks a distant second, followed by financials and staples. Every other sector is currently down on the year. The entire Fixed Income universe has delivered nothing but pain to investors.
FI Flows Rundown
IG bond outflows past 7 weeks ($1.9bn)
HY bond outflows past 7 weeks ($2.8bn)
EM debt outflows past 7 weeks ($0.5bn)
Munis outflows past 2 weeks ($0.2bn)
MBS outflows past 14 weeks ($0.3bn)
Govt/Tsy inflows past 7 weeks ($1.3bn)
1st TIPS inflow in 5 weeks ($39mn)
Bank loan inflows past 12 weeks ($0.8bn)
Equity Flows Rundown
US: inflows past 5 weeks ($1.7bn)
Japan: outflows past 3 weeks ($0.6bn)
Europe: largest outflow in 3 months ($1.8bn)
EM: inflows past 9 weeks ($3.0bn)
By style:
inflows US Large cap ($5.7bn), US Value ($1.6bn)
outflows US Small cap ($0.4bn), US Growth ($2.2bn).
By sector:
inflows Materials ($1.3bn), Real Estate ($0.1bn)
outflows Comm services ($27mn), Consumer Staples ($34mn), Utilities ($0.2bn), Tech ($0.3bn), Energy ($0.7bn), Financials ($0.7bn), Healthcare ($0.8bn).
Thanks for reading. I hope you’re having a peaceful and relaxing weekend!
Best wishes,
—Avery
Looking for some more to read? Check out one of the articles below, or simply visit the main page.