


All of The Indicators At Once
Where are we headed next? Let's check some indicators.

I’ll go through a number of indicators here, but at the end of this all, I will tell you to stay the course and not time the market. I’ll also touch on margin debt and market timing. Margin debt seems to be a good indicator.
With that out of the way, here’s a LOT of indicators…

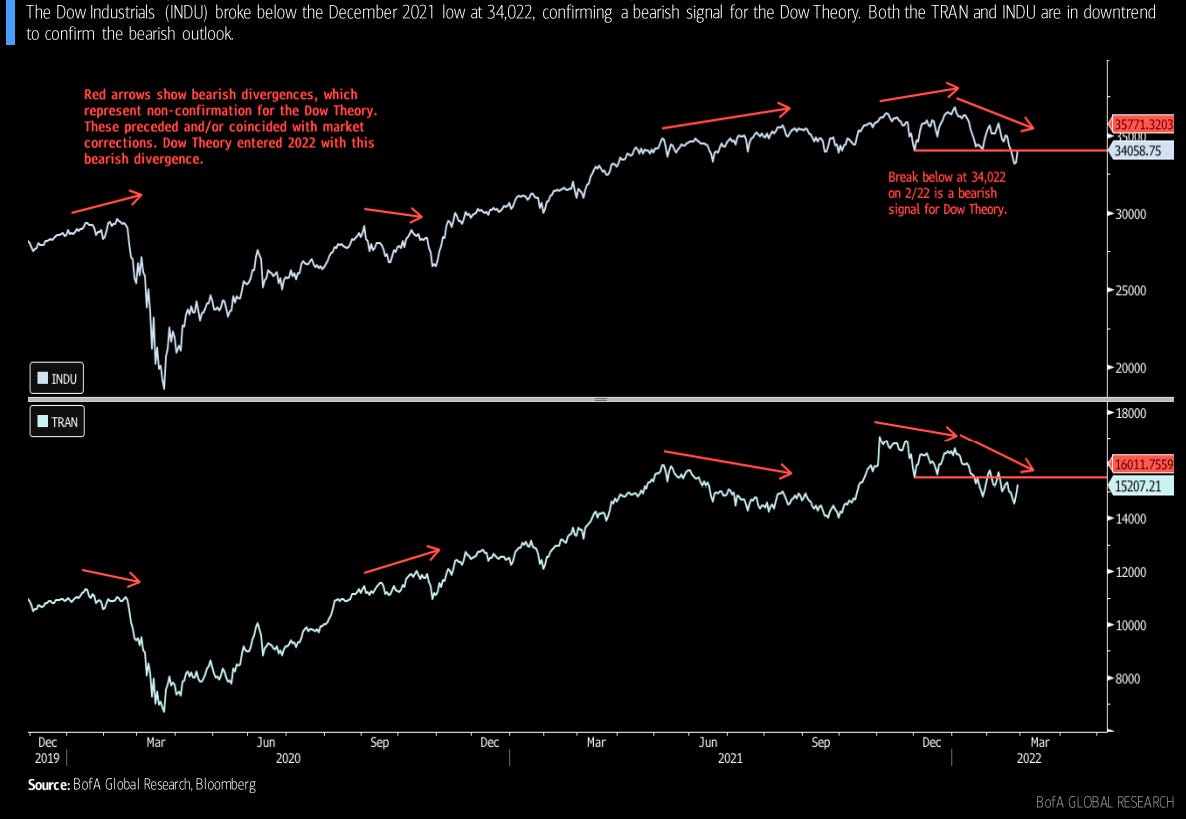
Dow Theory
The “Dow theory” on stock price movement, popularized by Charles H. Dow (founder of Dow Jones and the Wall Street Journal), and derived from 255 editorials written for the WSJ is one of the oldest indicators around. The theory says that the market is in an “upward trend” when one constituent (i.e. transports or industrials) reaches a “higher high” while another constituent also has a similar advance.

In short, when the Transport average and the Industrials average are both making new highs, then the Dow is said to be in an upward trend.”
One of the earliest indicators around.
Heading into 2022, the Dow Industrials (INDU) and Dow Transports (TRAN) began with a “non-confirmation” that increased the risk for a correction in US equities. Dow Theory would suggest that a move below 34,000 on 2/22 should confirm a weaker trend for TRAN, and as such, would be a bearish signal according to Dow Theory.
Personally, I don’t find this indicator very actionable, but I did think the chart was pretty. Let’s take a look at some other indicators.
Credit Spreads
Credit spreads are currently in a “mature cycle”, per BofA following the extremes of the March 2020 correction. An index of BAA-rated corporates vs. the US 10-year note has weakened from its low of 1.67 in November, and moved above 2.0 on February 16th. This is viewed by some as a risk-off signal, with 2.5 being the next major level. Large corrections for US equities have happened when the BAA vs. 10y spread widens beyond 2.5
Corporate BAA vs. US 10-year Treasury Spread: Daily chart

Financial Conditions Weakening
S&P 500 (top) and Bloomberg’s US Financial Conditions Index (BFCIUS) (bottom): Weekly Chart

Sentiment: Silver Lining?
AAII bull sentiment dropped below 20% and as a contrarian indicator, this should be bullish. Skeptical investors tell us not to give up on the secular bull market, even as cyclical risk, war, and the threat of rising rates — a threat that is suddenly fading, as will all other threats — is turning out Baby’s First Bear Market.
This is the first time since May 2016 that the AAII Bulls sentiment reading moved past 20%.

The following table shows the “first” 13 moves below 20%, while ignoring repeat signals (signals that come within 30 days of the most recent signal).
With the exception of January 2008, this signal has indicated strong forward returns for the #SPX. See for yourself.
S&P 500 forward returns after “first moves” below 20% for AAII Bulls

S&P 500 summary data for forward returns after a first move below 20%

All period forward returns for the S&P 500 from September 1987

Farrel Sentiment
The Bob Farrell sentiment indicator (click for explanation) for US equities has waned since peaking in April 2021. This indicator has moved to a contrarian bullish level under 0.5 as of February 18th. Prior voyages to the sub-0.5 realm, along with moves up from that area, and pushes ABOVE 0.5 have all been bullish signals for US equities. The last signal for this indicator was in October of 2020, just before the Presidential Election. This is approximately when there the market realized that anti-trust legislation would be unlikely given the potential deadlock in the US senate.
Brief explanation:

The S&P 500 (top) and Bob Farrell Sentiment indicator (bottom), daily

BofA notes that the first move up from sub-0.5 levels has delivered healthy returns.

Farrel Sentiment Indicator first uptick after a break below 0.5 — forward returns for all observations from September 1987 to present

Historical returns following the first uptick in the Farrell Sentiment indicator:

BofA further notes that a break ABOVE 0.5 shows strong returns:

Historical data on S&P 500 forward returns following a return to levels ABOVE 0.5:


Ranks, Rotations, and Relatives
Going by sector and using simple 40/26/13-week moving averages and trend positions, BofA arrives on the following indicators:


52-week ranks:

Relative Rotation Graph (RRG)

Leading: Energy $XLE, Financials $XLF, Utilities $XLU, Health Care $XLV, Materials $XLB, Staples $XLP
Weakening: Real Estate $XLRE, Tech $XLK
Lagging: Discretionary $XLY, Communication $XLC
Improving: Industrials $XLI
Cyclical Sectors
Leadership breakout from financials and relative stability for industrials.

The yield on the US10Y treasury has moved considerably higher since December, and cyclicals have tried to reestablish leadership. Financials had technical support, and then broke vs. the #SPX. Industrials appear relatively stable. Technical analysis from BofA suggests a breakout. I don’t agree, but take it for what it is. Some moving average stuff.

Same story here. I’m not a fan of this type of technical analysis, and think price action is largely fractal, but if they’re of use to you, then I’m happy to share.

$XLK and $XLY. Pretty charts!

$SOXX and $XLC weekly charts. Again, these are of little-to-no use to me, but I may be an outlier there.
Might as well share them all. Here’s $XLU and $XLP:

$XLRE and $XLV:

Sub-sector / group ranks / screens
Sectors & groups with bullish trading cycles:
BofA lists bullish trading cycles by rising 26/40-week MAs on both an absolute and relative basis.
These are: Energy $XLE, MLPs $AMLP, Life Insurance, P&C Insurance, Banks $KBWB, Insurance $KIe, Tech Hardwear $IGM, Financials $XLF, Consumer Staples $XLP, Pharmaceutical $IHE, Capital Markets $KCE, Information Technology and Semiconductors $XLK
Sectors with bearish trading cycles
Materials $XLB, Telecoms $XTL, Housing, Retailing $XRT, NYSE ARCA Biotechnology $XBI, Communication Services $XLC, and Biotech $IBB.

For GICS Level 2 sectors, see the following (Table 15), which also uses 26/40-week MAs to determine bullish/bearish/neutral trends:

We also have SectorPulse, which suggests up to three longs and three shorts per week. SectorPulse uses two machine learning algorithms: XG Boost, which uses multiple technical inputs like momentum and RSI, as well as BofA’s proprietary “Analyst Tone” NLP indicator, which is run on their own fundamental equity reports. This is meant to predict if a sector has positive or negative returns for next week.
Various screens must be run to detect market stress anomalies to augment short sector signals and avoid long signals during periods of extreme volatility. In short, the strategy goes long up to three sectors when the XG Boost model predicts a probability of over 0.52 and there are no GFSI anomalies detected.
Per BofA, the XG Boost models’ predicted probability is greater than 0.52 and there are no GFSI anomalies detected. Therefore, the SectorPulse signal as of 2/25/2022 weekly closing prices has three longs: Communication Services $XLC, Tech $XLK, and Staples $XLP.

For a deeper dive, see below.

Net Tab at +2 vs oversold at +3 to +6
(Net Tab is a leading breadth and sentiment indicator designed to measure macro overbought and oversold conditions. It uses six factors, each of which employ different methods to measure investor sentiment and market breadth. The values produced by each component are +1, 0, or -1. The resulting value is known as “Net Tab”, or “The Net Tab Indicator”)

A negative divergence for the Net Tab (lower indicator highs vs higher highs on the SPX) from mid 2021 into January 2022 indicates a challenging equity market for 2022, according to BofA. The Net Tab dropped to +2, indicating a corrective phase for US equities. A +2 reading puts this indicator close to oversold (+3 to +6), which was last seen during the March 2020 correction.


Margin Debt Deleveraging
While many market participants worry about rising margin debt, or consider it a bearish signal, I’ve always been concerned when I see margin debt dropping.
From January 2021:

In May of 2021, Bloomberg reported that “investors have pointed to a worrying trend at brokerages: ballooning margin debt” (quotation marks quite intentional):


This shouldn’t be a worrying event, but the extent of the margin draw was quite significant.. Margin debt normally rises during bull markets. What’s more important to me, is that a fall in margin debt often presages declines in equity valuations.
The S&P 500 and FINRA margin debt (top) and FINRA margin debt 12-month rate-of-change chart (monthly, bottom)

Seeing margin debt drop like this DOES concern me, and margin debt began falling off in November.
If you were following my Twitter account on January 1st of this year, you’d have seen my reaction. I can’t find the chart I posted, but margin debt seemed to take a sharp downward turn in mid-December. After going on and on about the Nasdaq being overvalued, by the time 2022 rolled around, I felt we were in a bubble:
”All the hallmarks of a bubble are plain to see. I think the market is only continuing higher on margin debt and derivatives. You can’t suspend gravity forever, even with tax cuts/stimulus/rates”.
Skip to the end if you don’t need any encouragement to stay in the market.
Market Timings and “Calling the Top”

I should’ve been more bold with this call, but I didn’t want to get into any arguments. Nor did I want to get attacked for being misleading or shaking people out, if the market kept going up. It did go up, on the 3rd. Then all it’s done since then is gone down.
I’m not a big fan of calling tops, and have only done so twice. I should probably avoid doing it altogether. That said, I managed to get this one within a day. I think it’s fair to brag a little bit, as I’ve only done this on January 1st 2022 and February 21st, 2021. I did not go to cash this January. I’ll explain why shortly.

I think I just accidentally deleted this tweet… Ugh… I guess you’ll have to trust me. :(
Despite “calling the top” in 2022, I merely thought it was the Nasdaq that was overpriced, and plowed into value and international stocks. For almost every day of 2022, I’ve maintained 98-100% equity exposure. Calling the top is one thing, but calling the bottom is something else. It’s not something I want to try again during my lifetime. If you think I’m good at getting in and out of the market, please know this: I have zero faith in my ability to do EITHER of these things. I don’t think ANYBODY is.
To complete the story: In 2020, it was Covid that scared me, on top of valuations that I already thought were quite high. I promised myself that I would get out of the market once people were wearing masks in Times Square. Then, it happened. And so, I got out.

More people wearing masks on the front page of the New York Times. I should’ve gotten out even earlier! 😉
So, we’ve all got our indicators. Sometimes they work. Sometimes they don’t. Sometimes you get lucky, and your own made-up nonsense indicator could’ve or would’ve gotten you out of the market before a precipitous drop. This sounds great, but it’s mostly pointless. The market mostly just goes up, and staying invested is the only sure-fire way to financial freedom. That’s all we should care about.

I do need to emphasize: timing the market is, as I’ve mentioned before, hazardous to your wealth. I’ve made a point of staying in the market this year, and waiting out whatever developments may occur. If you aren’t able to stay in the market during drawdowns, then you’ve taken on too much risk.
If your equity exposure and risk appetite are properly aligned, then you’ll never need to worry about drawdowns, crashes, let alone timing the market. You’re far more likely to miss a big up move than a down move. Why? Sentiment craters around the time markets rebound. Markets go up far more often than they go down. You should be buying weekly or biweekly. You can’t do that when you’re out of the market. You don’t get dividends, either. Being out of the market requires far more attention than being in the market. Far more work. Avoid it at all costs, is what I say.
Looking back, I seriously regret going to cash before CV19. Sure, the timing was great, but I could’ve VERY easily missed some huge up days that I’d never have gotten back. I’ve learned from that mistake, and I won’t make it again. I’m staying in the market.
The biggest up moves always happen when the least number of people expect them to. The amount of money, after compounding, one can lose in just a few days is truly astronomical.

In short: stay the course. If you can’t, you’re not ready to invest in risk assets. This isn’t meant to be an insult or a challenge. The fact of the matter is that investing is inherently risky. Only though taking on that risk, including the risk of drawdown, will you realize the lifetime returns promised to you by sleek investing brochures.
It’s about patience, discipline, and willpower.
Thanks so much for reading, and enjoy the rest of your week.
—Avery
Exactly what I was looking for. I tried to be a trader but its too much on me. This article convinced me enough to stay the course. Thank you so much🙏
Good stuff. Thanks for sharing.