

Charting Liquidity and the Fed Flowjob
Charting Liquidity and the Fed Flowjob
Liquidity, tech, and growth are being burned at the stake

The incredibly popular (or not) “Facebook vs Deutsche Bank relative share price” chart is basically just a chart of Facebook’s market cap, but here it is:
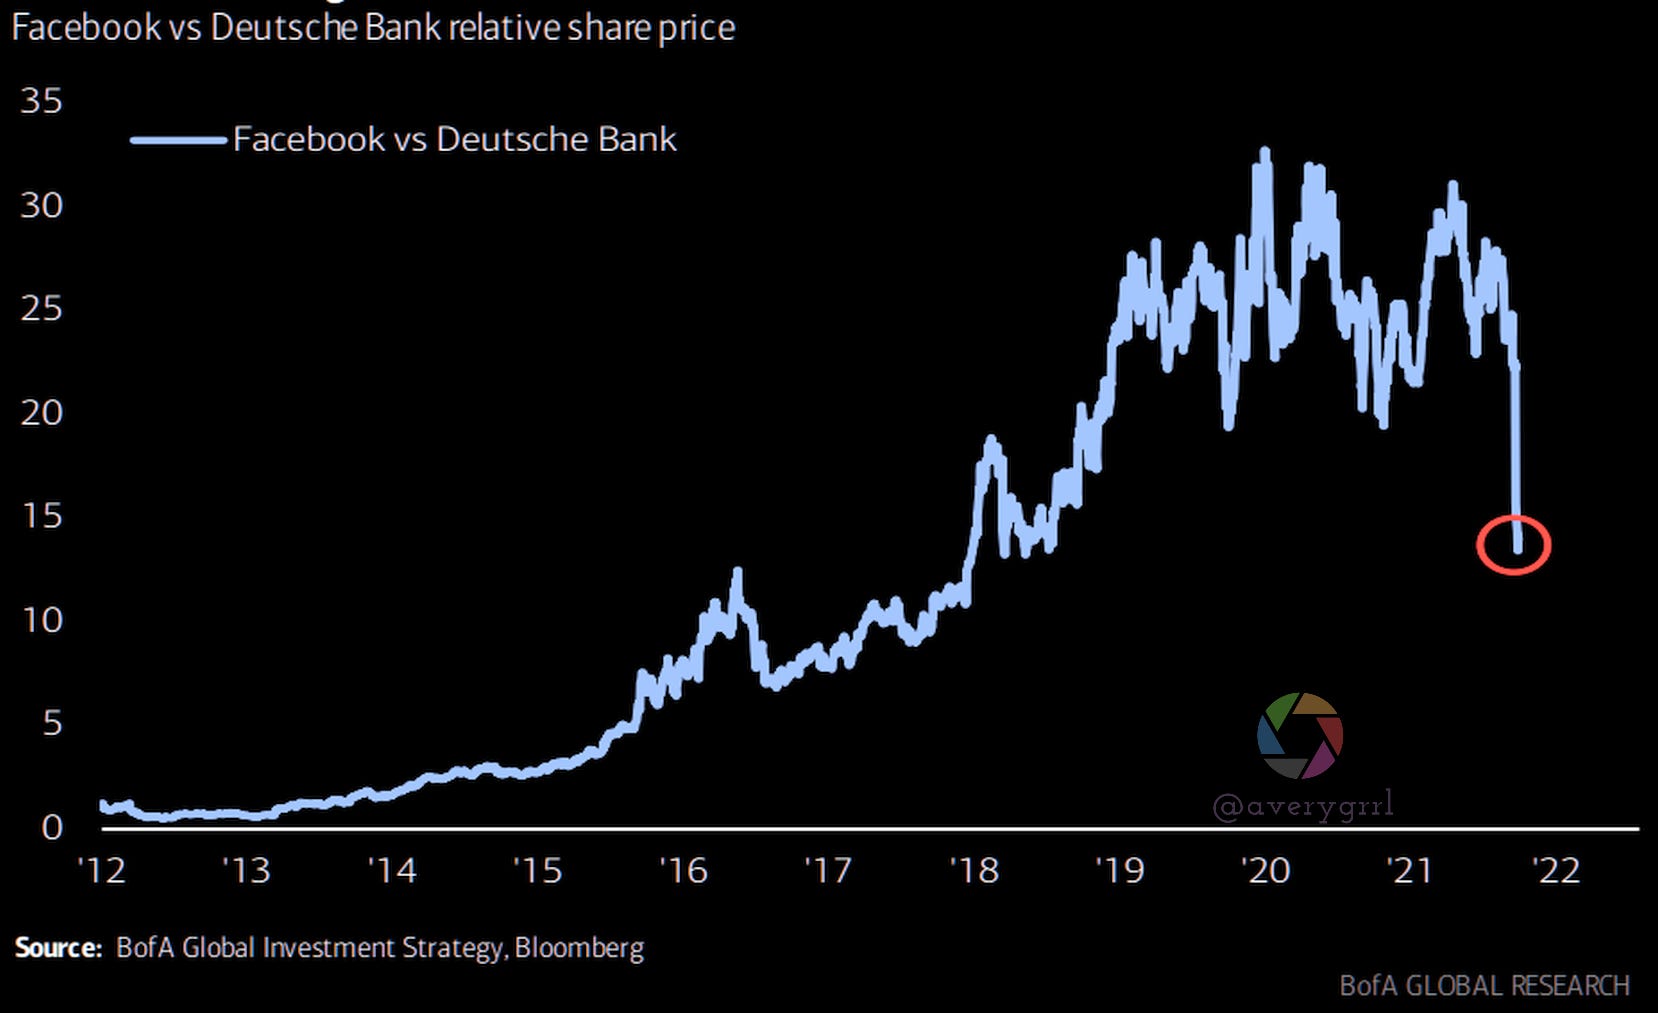
The fact is, tech/growth have been getting absolutely slaughtered. Hedge Funds have been reloading their short positions at the fastest rate in over a decade. Rather than targeting Smidcaps, the focus is on larger-cap names, and $FB is a primary target.
This isn’t something a group of redditors can fight.
So, how long do international stocks out-perform?

US and ex-US markets have moved in cycles
Since 1975, the outperformance cycle for US versus international stocks has lasted an average of 7.8 years.
For ex-us, out-performance has typically lasted ~5 years.
Here's a helpful chart:

The BofA Bull/Bear indicator has risen slightly from 3.8 in late January to 4.2.

From the AAII bull reading’s 6-week moving average vs. 8-week equity flows, we’re currently at a multi-year low, the lowest since August 2020.
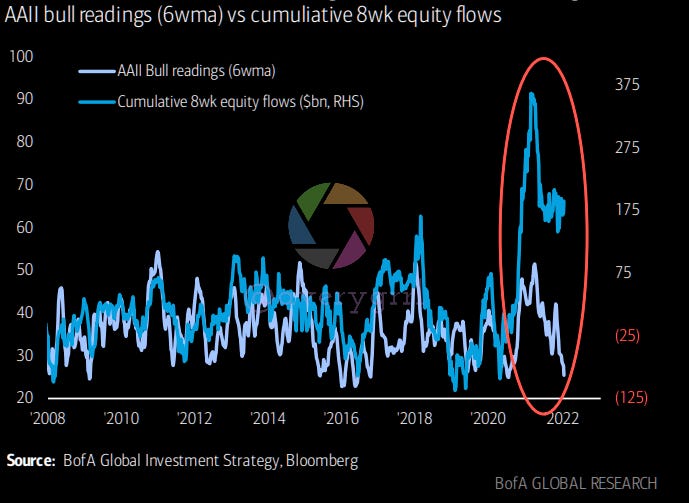
So, where’s the money at? I don’t believe in “money on the sidelines”. Either you’re in or you’re… dead to me, or out.
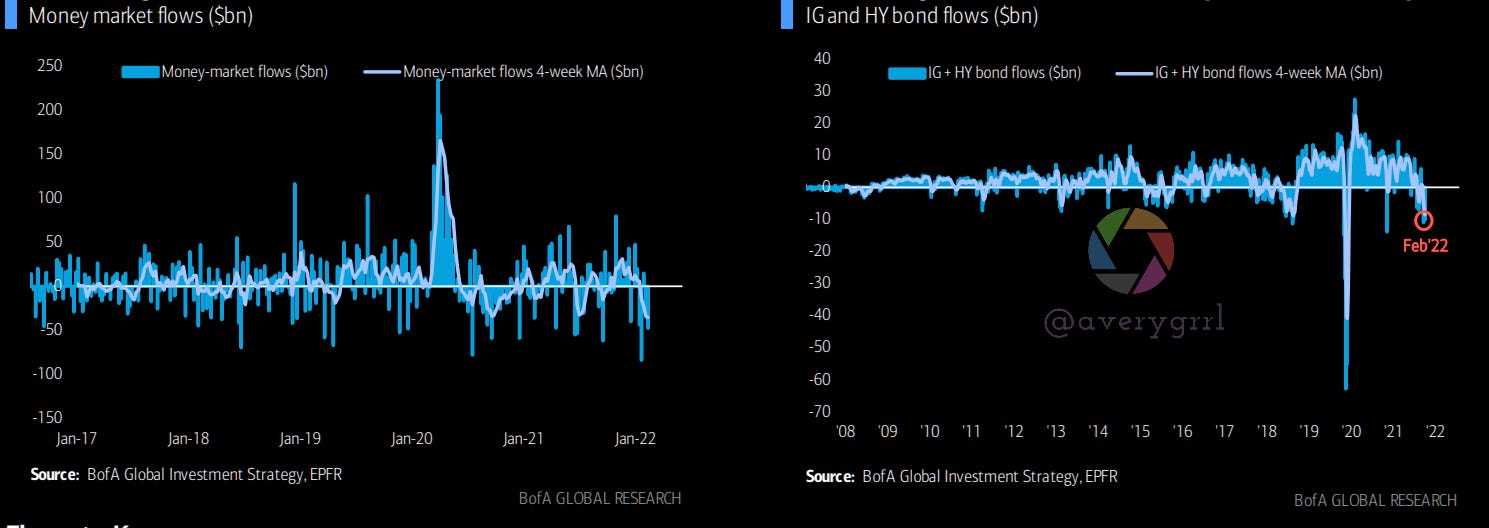
If we drill-down on money market and IG/HY bond flows, we’re not seeing inflows. Just the opposite; as of late January, we’re now seeing significant outflows, with record outflows from IG/HY bonds.
Largest 4-week outflow from cash/MMF ever (-$35.2bn).
This despite soon-to-be-inverted yield curve encouraging reallocation from long-end to short-end.
Largest 4-week outflow from corporate bonds since Apr’20 (-$8.6bn)
Largest inflow into US large cap equity funds ever ($34.1bn);
Cumulative equity flows YTD $153bn exceed pace of early-2021 ($151bn in '21, record year of $1tn inflows); this despite bullish “sentiment” as measured by AAII falling to lowest level since Aug’20; this despite big reversal in credit flows -$32bn in ’22 vs $58bn inflows in '21.
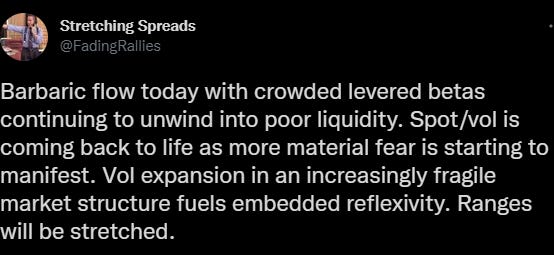
Stretching Spreads?
I’ve recommended following Fading’s (@fadingrallies) (aka Stretching Spreads”) account a few times. His commentary makes me chuckle, but it’s great. It can be a “blinded by science” experience, but I certainly find it interesting. I do hope his sanity is intact; once you venture to that side of Bloomberg, you rarely make it back alive.


“Barbaric flow today”
I love it.

RITA/Intraday Equity flow monitoring: depressing but interesting.


I’m avoiding the VIX and toxic liquidity. It’s always fascinating to look at, but no fun to participate in.
from: @fadingrallies
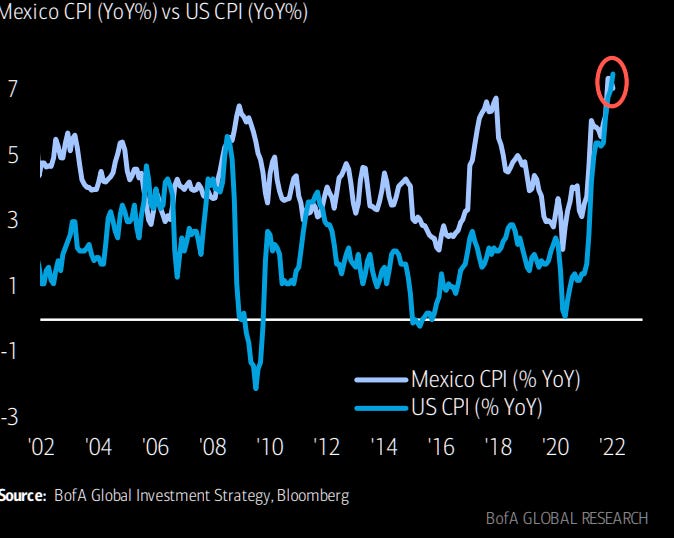
Inflation Math
Inflation math: Jan headline CPI 7.5%, core 6.0% (highest in 40 years); should torrid monthly gains of 0.6% MoM in core CPI continue year-end inflation 7-8%, moderation to 0.4% per month 5-6%, need 0.2% every month to get core CPI to 3% by end-‘22.

Hard to predict; let’s go with a probability distribution and hope for 5.3% or lower core CPI.
But hey, at least we’ve got Mexico beat! USA #!
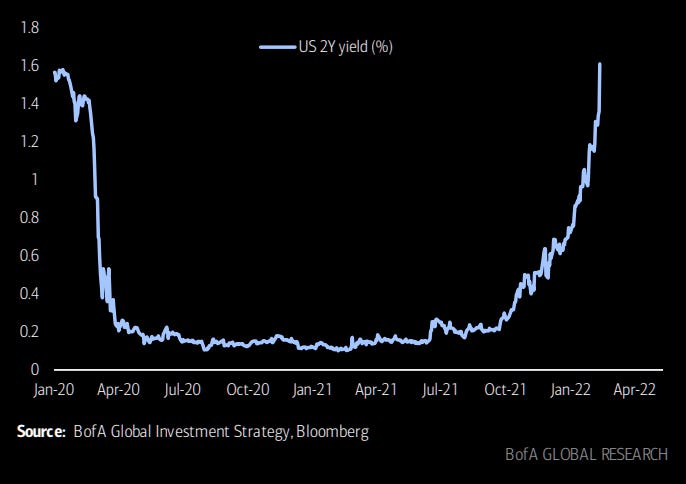
At this point, yields on the 2Y are starting to look like a joke. Apparently it’s not a joke, but I’m even starting to put a few pennies into treasuries here and there.
BoFA Private Client Flows/Allocations
BoFA was kind enough to share their private client inflows/outflows.
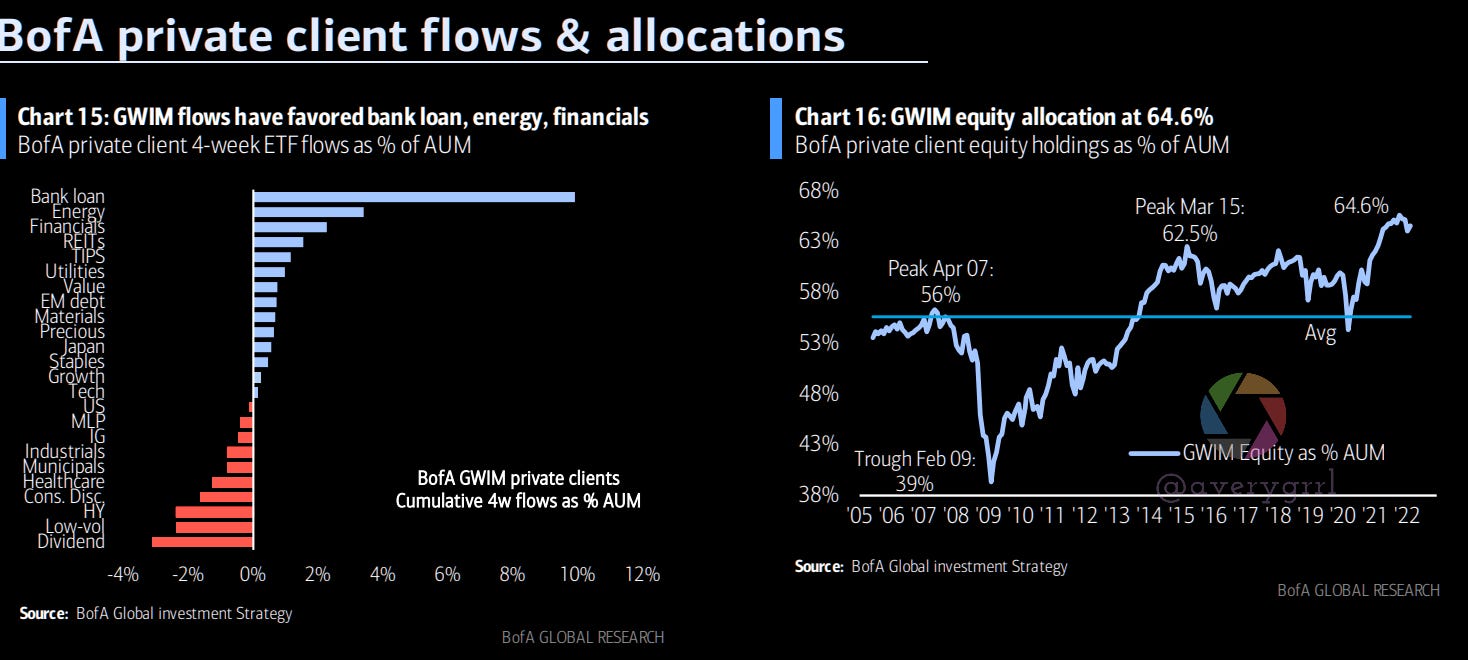
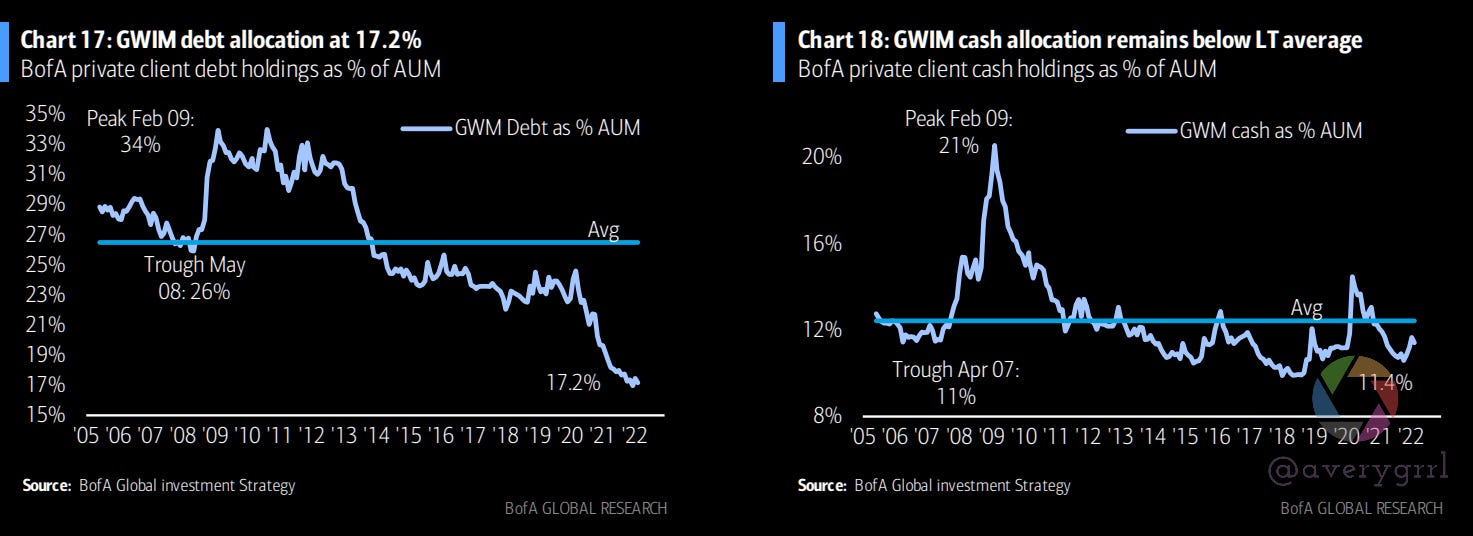

Source: BofA/ML
Cross-Asset Returns by Year Since 2000
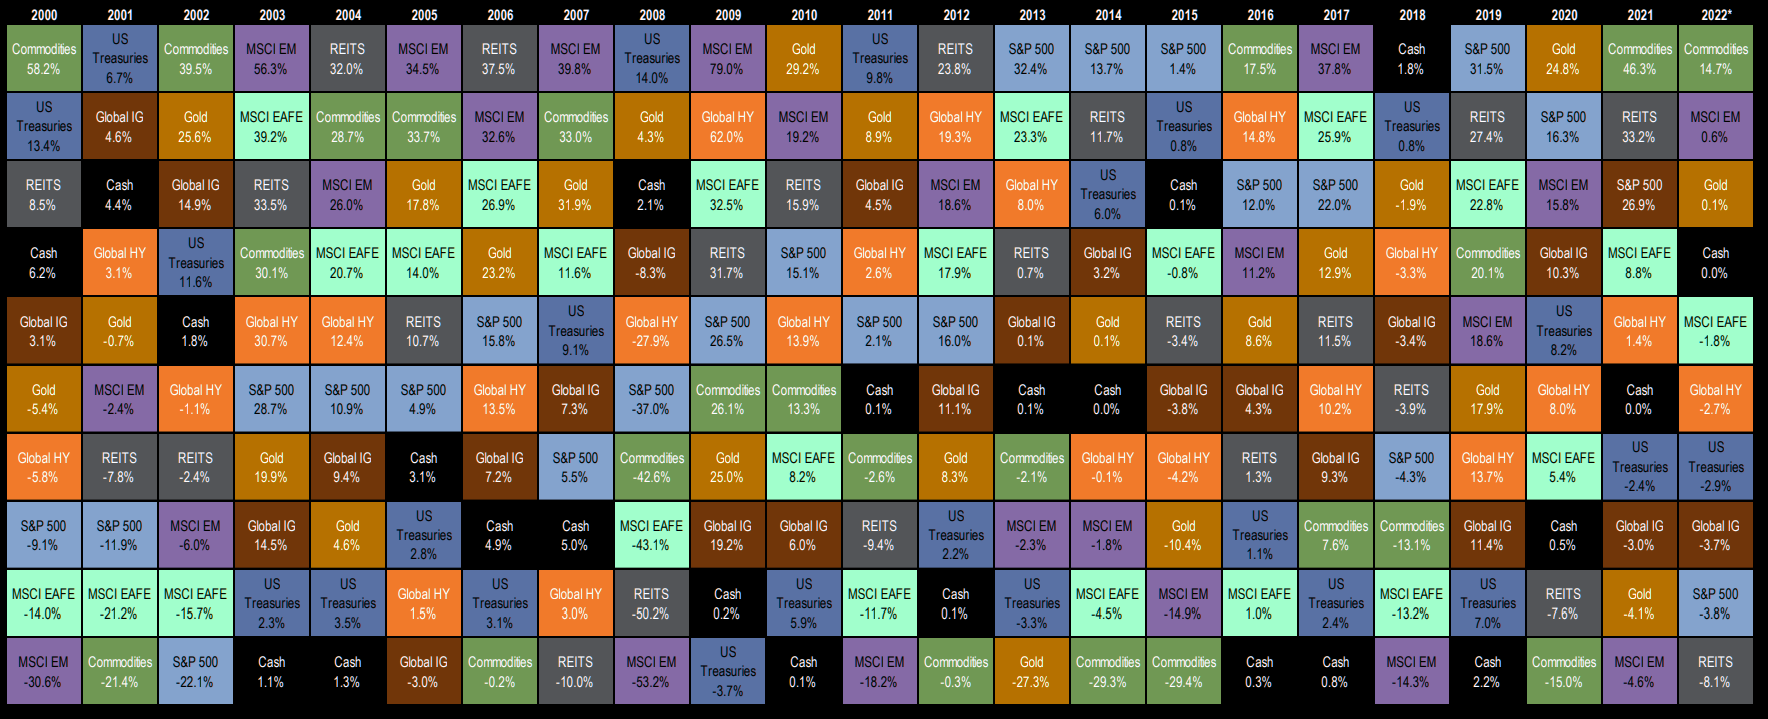
The past three years have been led by commodities twice in ‘21/’22, and gold in 2020. Great. #SPX has the lowest relative performance since 2002.
Even 2007/2008 were better for the #SPX compared to REITs, Commodities, EM, HY, Treasuries! EM dropped nearly -55% in 2008, EAFE -43%, REITS -50%.
SPX was -37% in 2008. Not bad, in comparison.
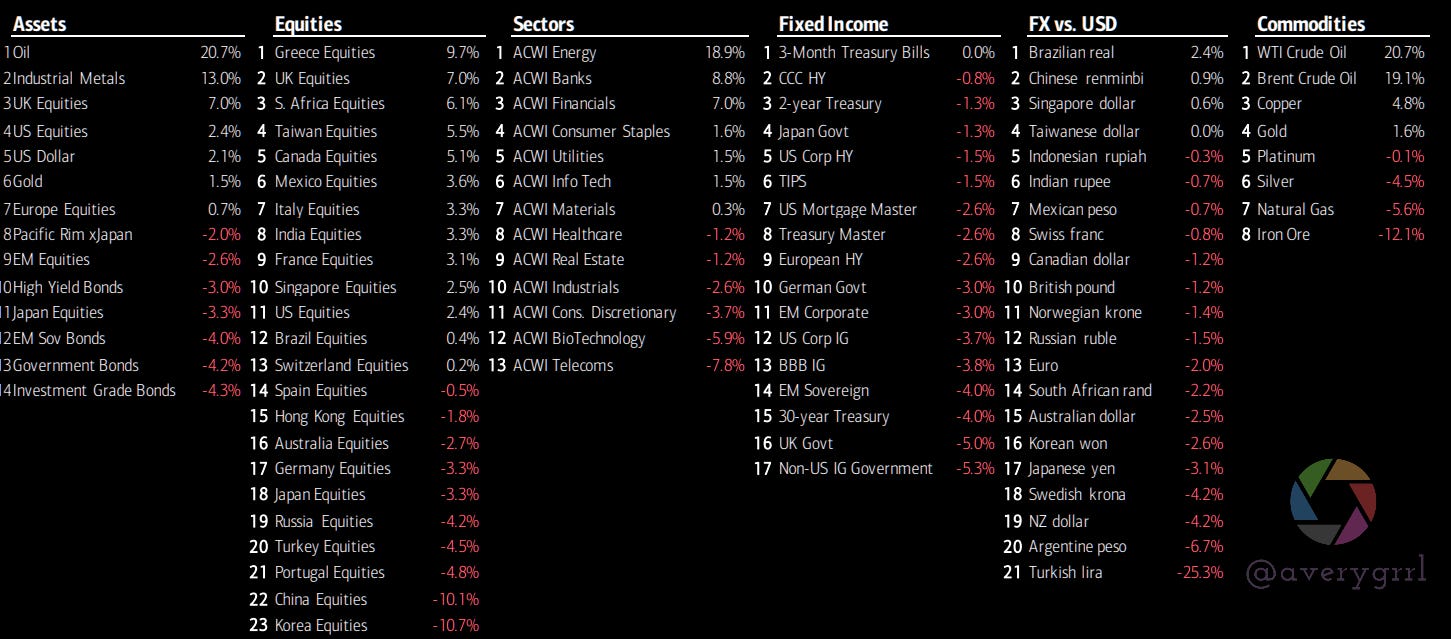
2022 Cross-Asset Winners & Losers
2022 YTD ranked returns Year-to-date ranked cross asset returns:

Oil/Iron, Brazil, Greece, South Africa, Turkey, Singapore, ACWI Energy/Banks/Financials… All have done quite well so far.
Every country ETF charted YTD, ICYMI:

Energy overbought, duration and EM relatively cheaper
Ranked Deviation from 200-Day Moving Average, USD-terms (as at 9 Feb’22):
Zooming out: BofA Bull/Bear indicator since 2002
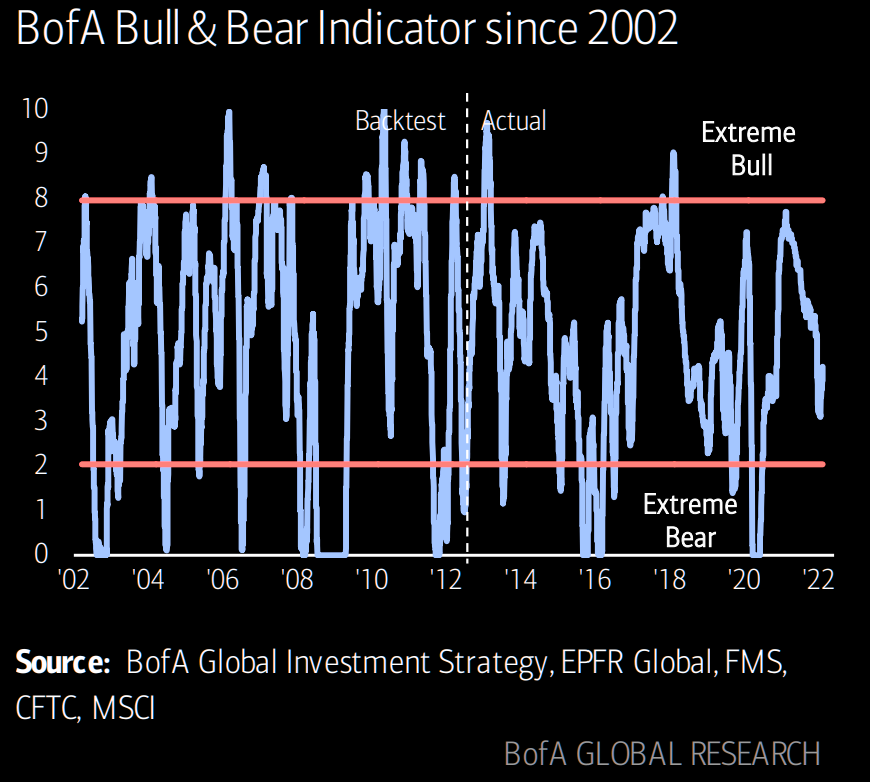
Just for sanity’s sake, let’s take a quick peek at BofA’s bull/bear indicator over the past 20 years, albeit with 2002-2012 as a backtest.
Here are the individual components of the current reading, if you’re curious (HF = Hedge Fund, LO = Long Only):
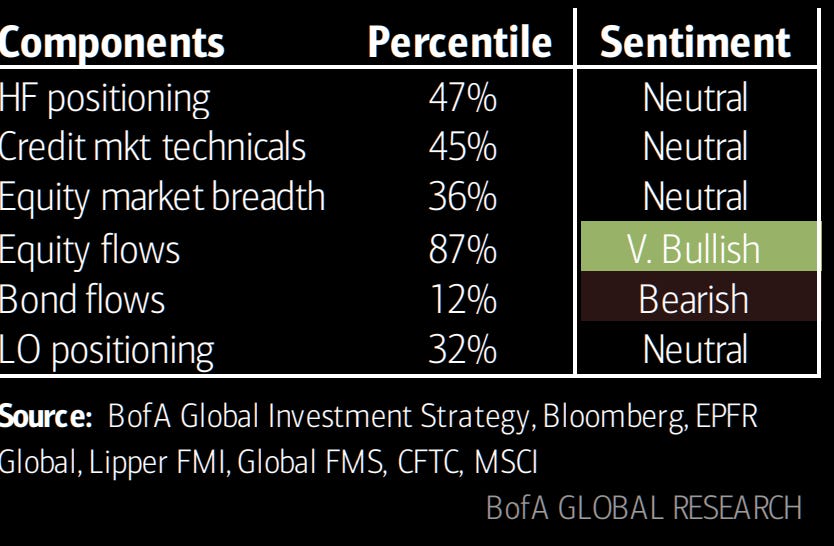
In short, equity flows look great. Liquidity and volatility look awful.
What’s the solution? I’m slowly buying international/value stocks, with a goal of putting more back into the S&P 500, but I’m not looking to get crushed by HFs on the warpath.
Bonds don’t appear to be an answer. Equities are the only way to beat inflation, although a 7.3%-yielding I Bond (you can buy 10k worth of those per year, btw), is probably pretty attractive to some.
EM is attractively valued, LATAM is hard to ignore in its performance. International diversification has never been so important, and active management is beating the pants off of passive, as the indexes are being hit by toxic flow, shorting, and volatility. This could mean a nice bounceback for the popular indexes, as oversold names correct.
Pricing on Front-End Rates: Looking Good
Just look at the pricing for front-end rates:
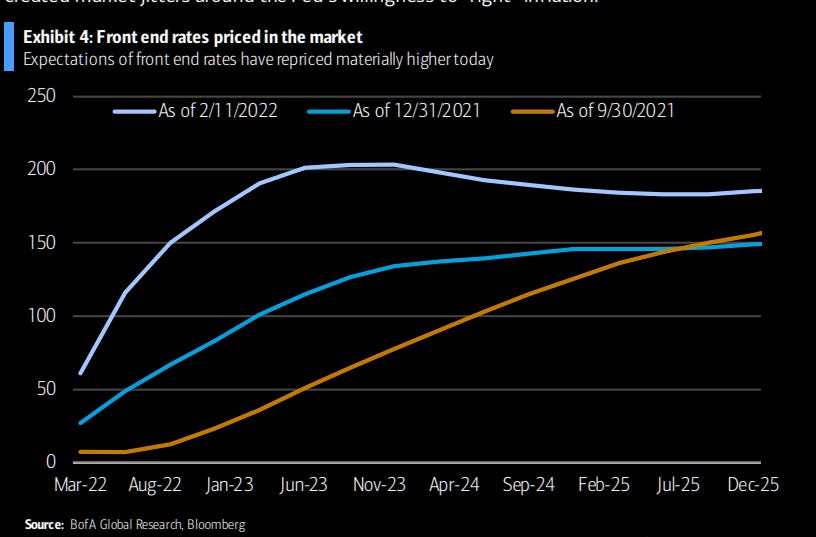
Source: Charts from BoFA Global Research
I think we’re going to be just fine.
It’s not exactly WW2 or the Cuban Missile Crisis. The US has been through an awful lot, and this feels like “not much at all”, in the grand scheme of things. Barring some kind of market panic-fest (which we’ve already seen quite enough of), the only reasonable way forward is to ensure ongoing exposure to the market risk factor as much as possible. They say that going to cash or delaying deposits is merely “delaying risk”, and as such, reducing returns.
I really stress the need to have a *written* portfolio action plan to adhere to, rather than trying to make decisions by the seat of your pants.
Something I hear once, and is relevant to equity reallocations is “slow is smooth, and smooth is fast”. There’s nothing wrong with moving a few percent of assets from one category to another over a long period, until you’ve achieved what you believe is your optimal asset allocation.
Equity Repricing
It’s not mystery that some companies have shed a tremendous amount of market cap. Each time this happens, it makes the standard indices look more and more attractive to own. This is, typically, just one of many reasons indices go on to beat their actively-managed counterparts. I’m currently in more active funds than i’d prefer to be, and welcome indexing with open arms.
For investors who are able to sit tight and wait this episode out, I think the rewards will be significant. It’s far too easy to miss a few big up days and permanently damage your equity curve. Just missing a couple days here and there can mean you need to work a second job just to retire.
That’s no fun.
Time In The Market > Timing The Market
Sure, it’s great if we can “dodge” a drawdown, but the reality is that most people can’t, won’t, or don’t get back into the market. Whatever scared them out is going to be far more scary when it comes time to put their money back to work.
I’ve seen it thousands of times, and it’s not pretty. It’s usually when the market is starting to look uninvestable that things turn around and there’s a series of violent up/down moves. The down moves always get erased by all the up moves. In trying to time the market, we often cost ourselves those big up moves, and that can add up to an awful lot of money when we get older.
I know at least one case where going to cash for FIVE DAYS cost an individual over $500,000 of their current portfolio’s worth. That’s 10 years of work for this individual. It’s an awful lot.
Something Completely Different
High-quality value companies have seen out-performance lately, and many can be accessed through ETFs and funds targeting companies paying dividends. I’m strongly against this approach.
While I will gladly use a dividend-focused ETF, it has absolutely nothing to do with the fact the companies pay dividends, and everything to do with the factor-loading of those specific companies.
If you haven’t already seen it, a quick watch of Ben Felix’s video “The Irrelevance of Dividend Investing” does a great job of explaining. Honestly, I am on the same page as Ben. I agree with 99.99% of what he says, I invest the same way he does, and I recommend investing the exact same way as him.
If he ever finishes studying Behavioral Investment Counselling, I’d be tempted to try and hire him away from PwC Capital, but I’d have to help him pay to get licensed in the US, and I imagine nobody actually wants to move here.
That said, I recommend his videos and his podcast series “The Rational Reminder”. I think we could all deal with being a bit more rational in this crazy market.
I hope you all have a lovely weekend. Thanks for reading!
—Avery
Really good stuff, thank you.
Fantastic, top-notch content! Not afraid of navigating the markets with this information!