

Global Fund Manager Survey
Global Fund Manager Survey
The Fed sends growth optimism to all-time lows

Bottom line: April FMS was bearish as fear of the Fed sent global growth optimism to an all-time low. Stability risks for Wall Street remain high; though not as bearish as the March FMS. Sentiment is poor; BofA Bull & Bear Indicator back down to 2.0 (“buy signal”).
The Fed is expected to hike 7 times (up from 4); tightening until H1’23. Risk of monetary policy mistake at an all-time high (83%). Fed “put” @ 3637 on #SPX.
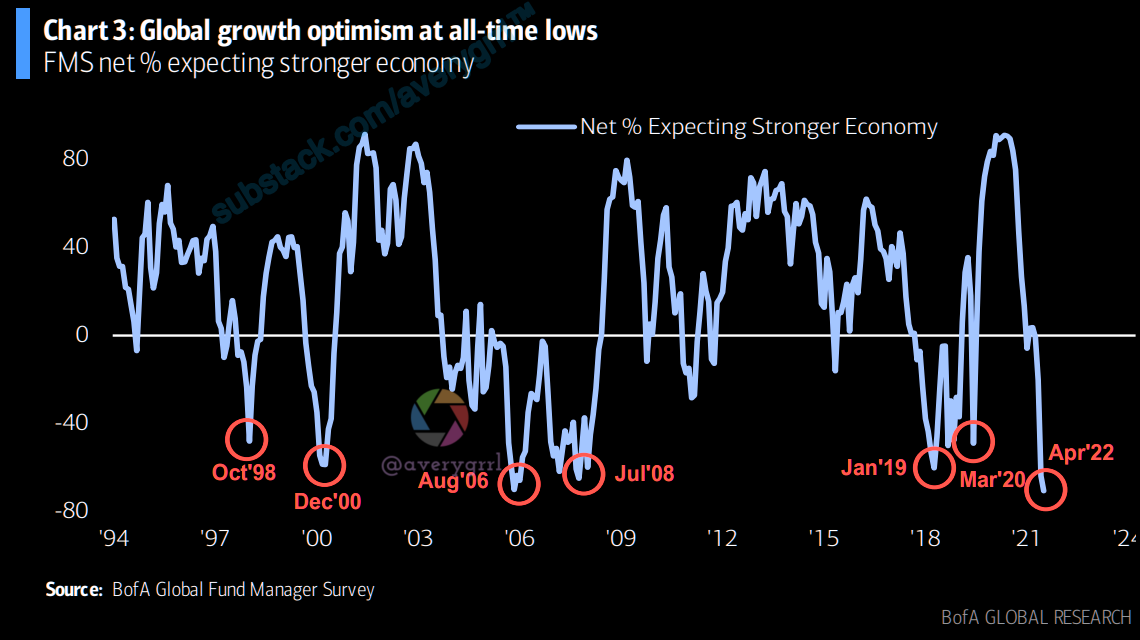
Global growth optimism is at an all time low (-71%), most since August ‘08. Predictions of stagflation, though most expect today’s hot inflation to cool off over the next year.
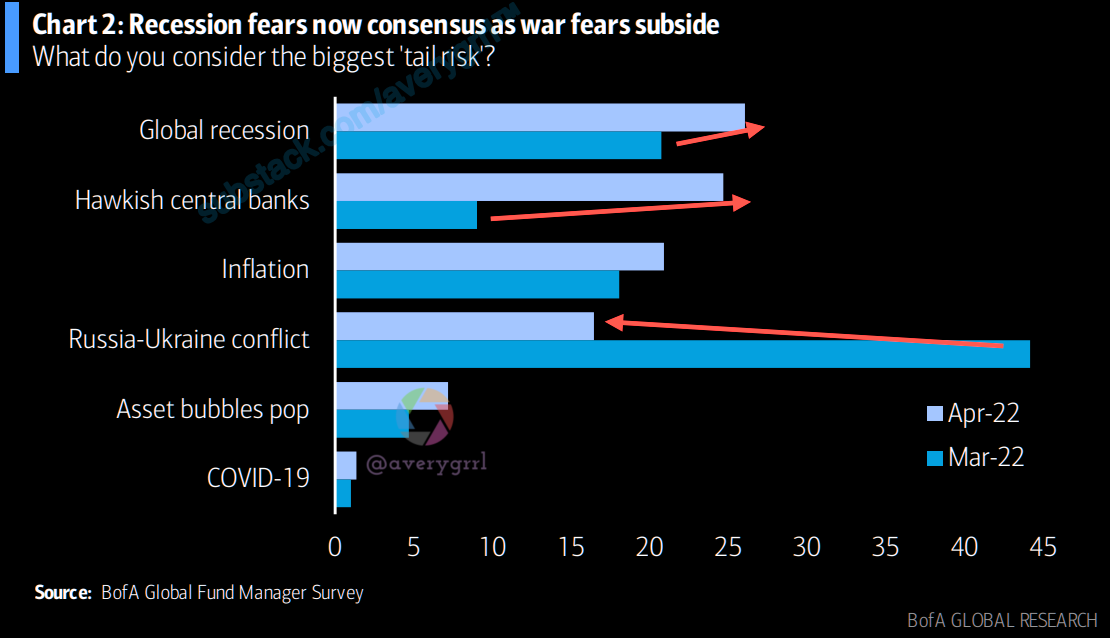
Cash levels dropped to 5.5% from an ultra-high 5.9%. “Predicted” #1 “tail risk” = recession, #2 = hawkish CBs, #3 = inflation, #4 = Russia/Ukraine. Financial Market Stability Risk index remains very high and consistent with #SPX <4000.
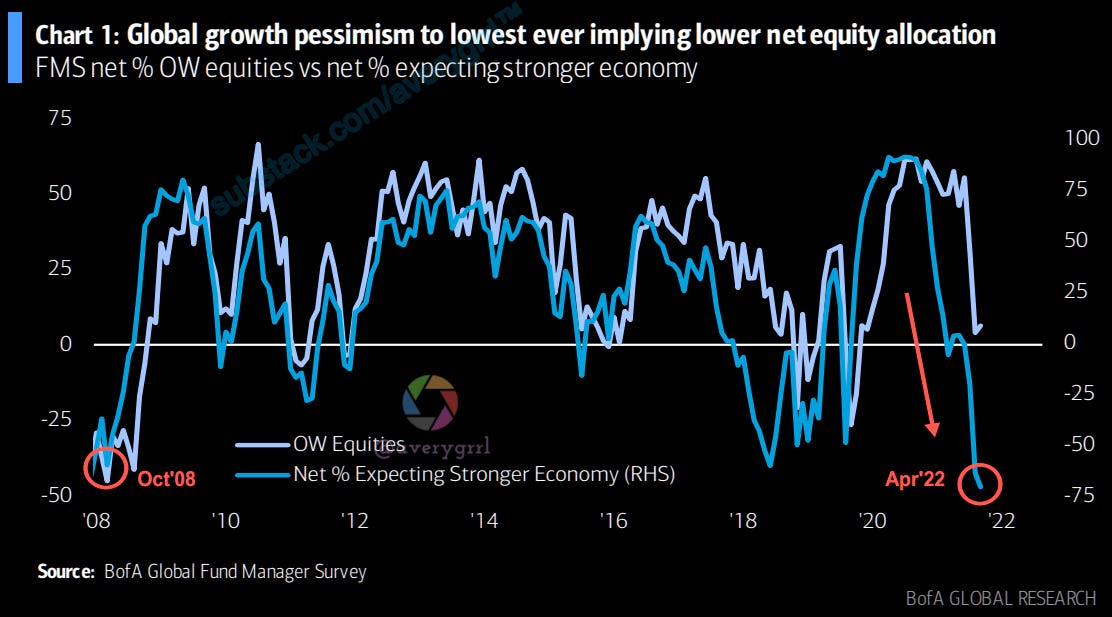
BofA’s April FMS shows that investor sentiment is bearish: global growth expectations plunged to their lowest level ever (net -71%). The disconnect between global growth and equity allocation remains staggering. Investors got slightly more bullish on equities. Though still at depressed levels, equities are nowhere near “recessionary” close-your-eyes-and-buy levels.
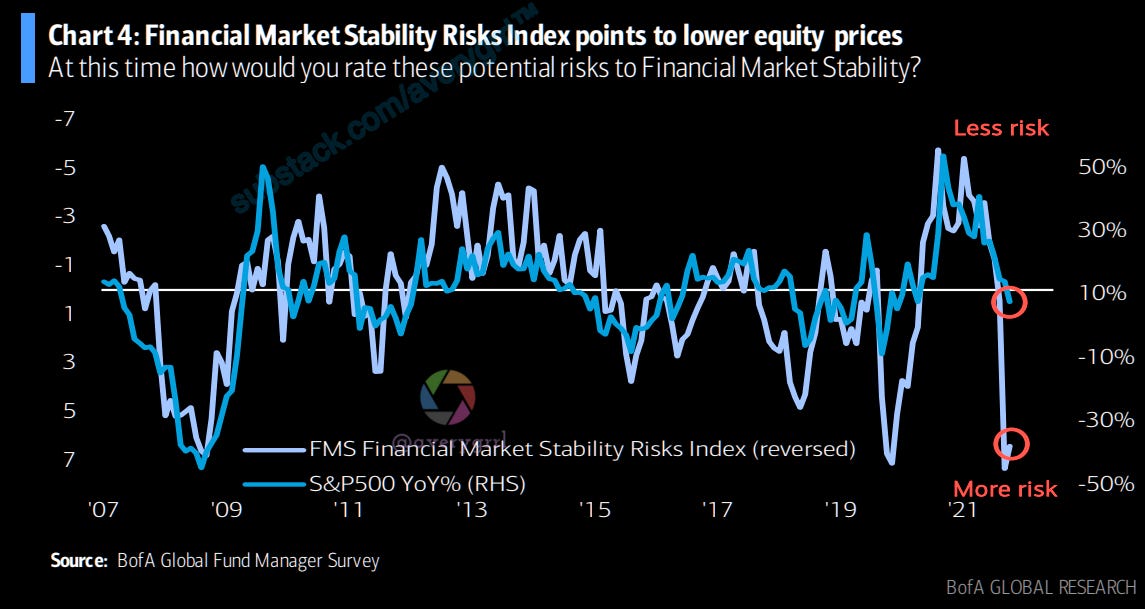
FMS Financial Market Stability Risks Index is currently at 6.4. Investors are seeing risk levels comparable to the COVID shock and GFC. The high perceived risk to financial market stability points to a further decline in equity prices.
This chart is the sum of the z-scores (from Chart 27) to create a FMS Financial Market Stability Risks Index.
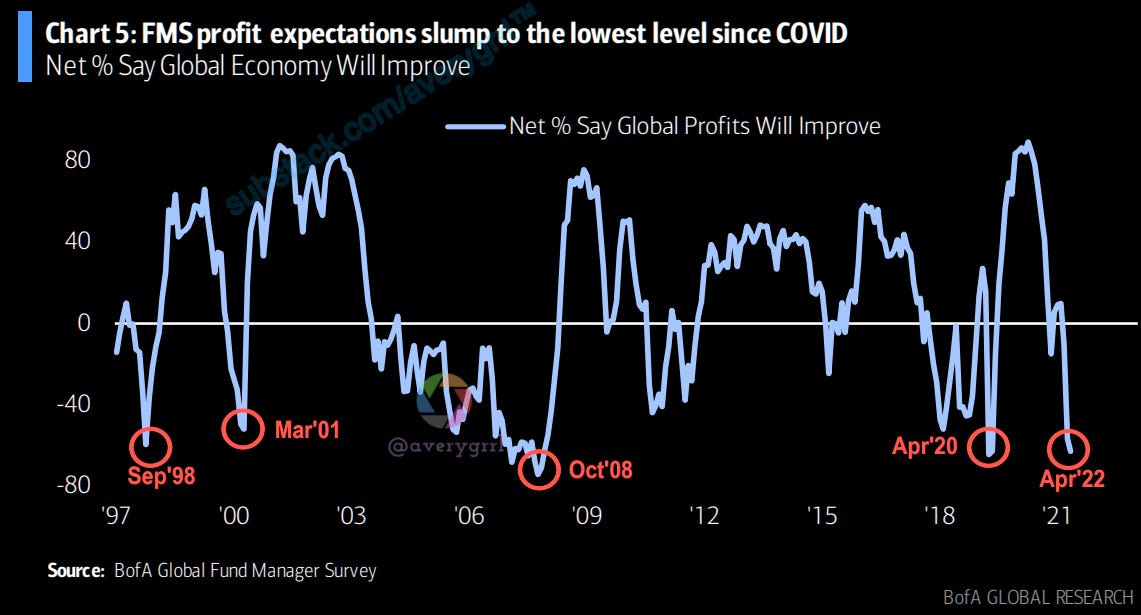
Global profit expectations have deteriorated to net -63% in Apr’22, the weakest since Mar’20. Other previous instances of such low levels include the collapse of LTCM, bursting of the Dotcom bubble, Lehman bankruptcy, and COVID.

“Stagflation” expectations jump to 66% (from 62%), the most since Aug’08.
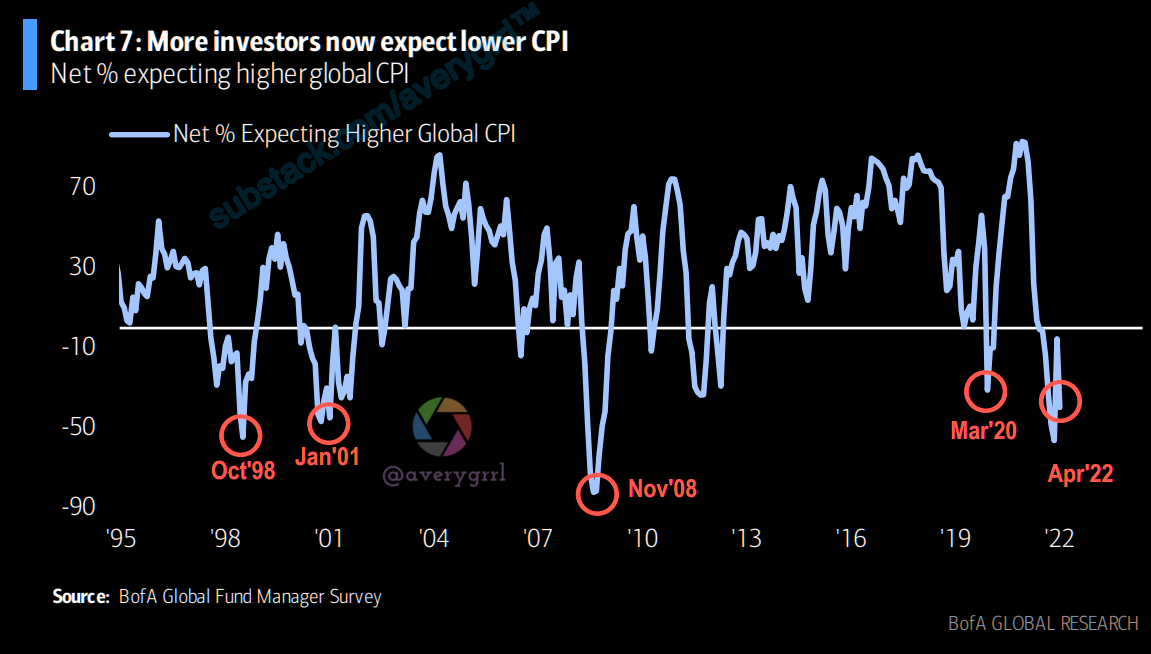
The net % FMS investors thinking inflation will trend lower increased to net 40% (note recessionary levels averaged -57%)…
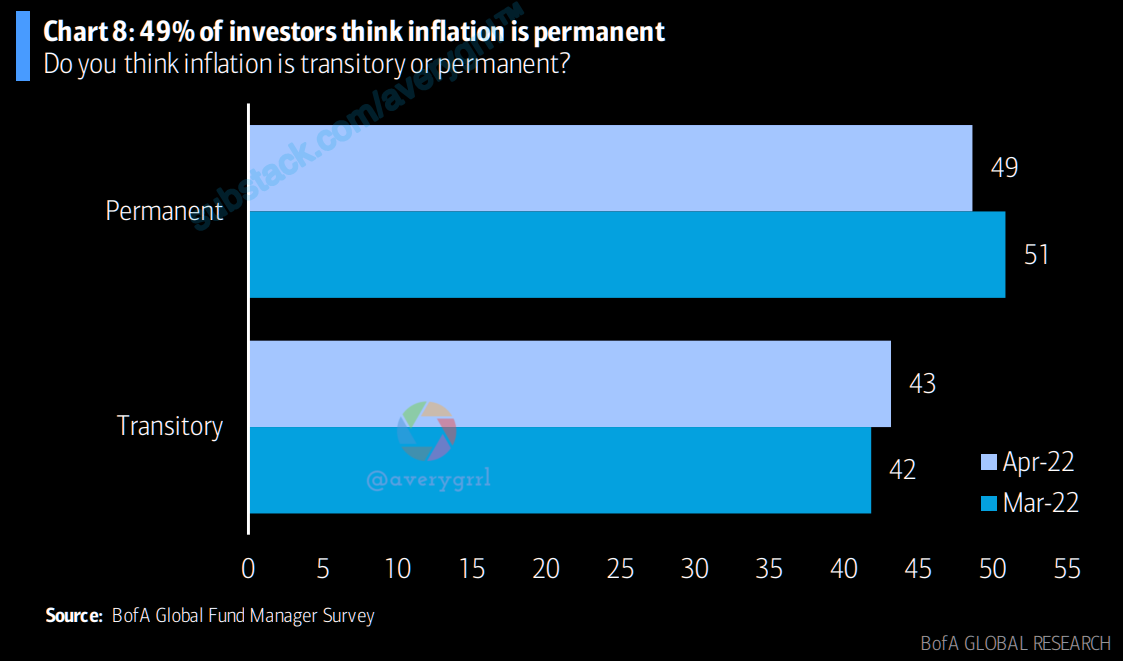
…while the number respondents that think inflation is permanent fell to 49% (from 51%). 43% of investors think it is transitory.

With war fears fading, stagflation fears have risen along with monetary risk, now to its highest level ever…

…with FMS investors now expecting 7.4 Fed hikes in 2022 (up from 4.4 in Mar)...

…with the tightening cycle now expected to finish in Apr’23.
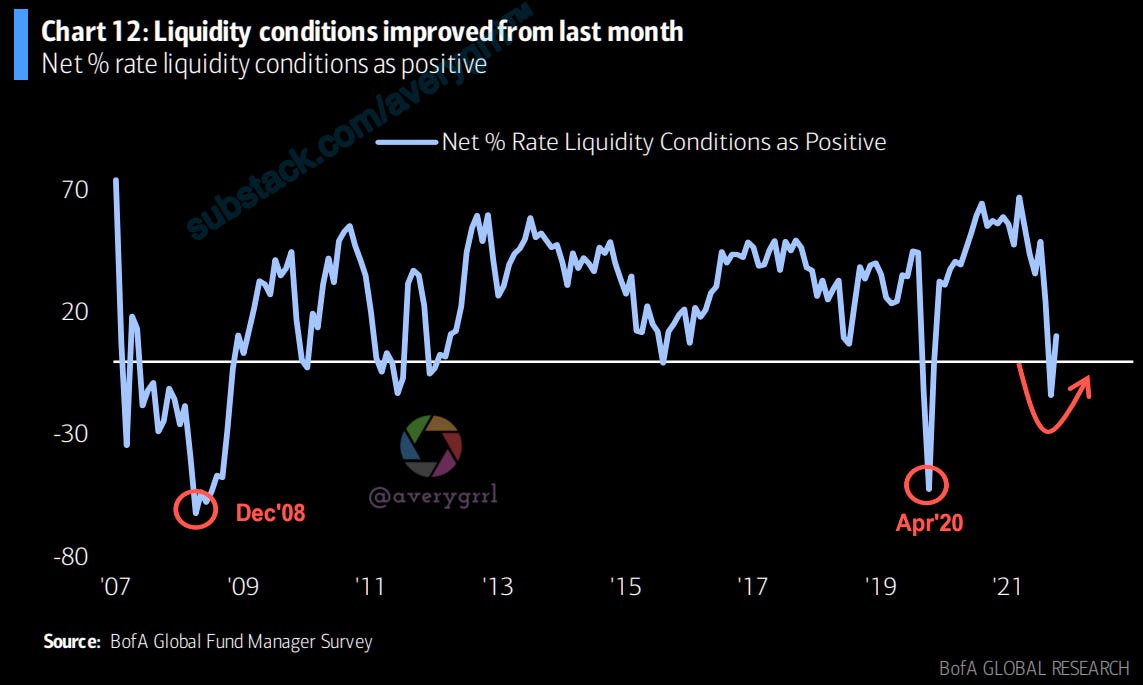
Liquidity conditions have improved to net +11% (from -14% last month), giving the Fed more leeway to hike rates.
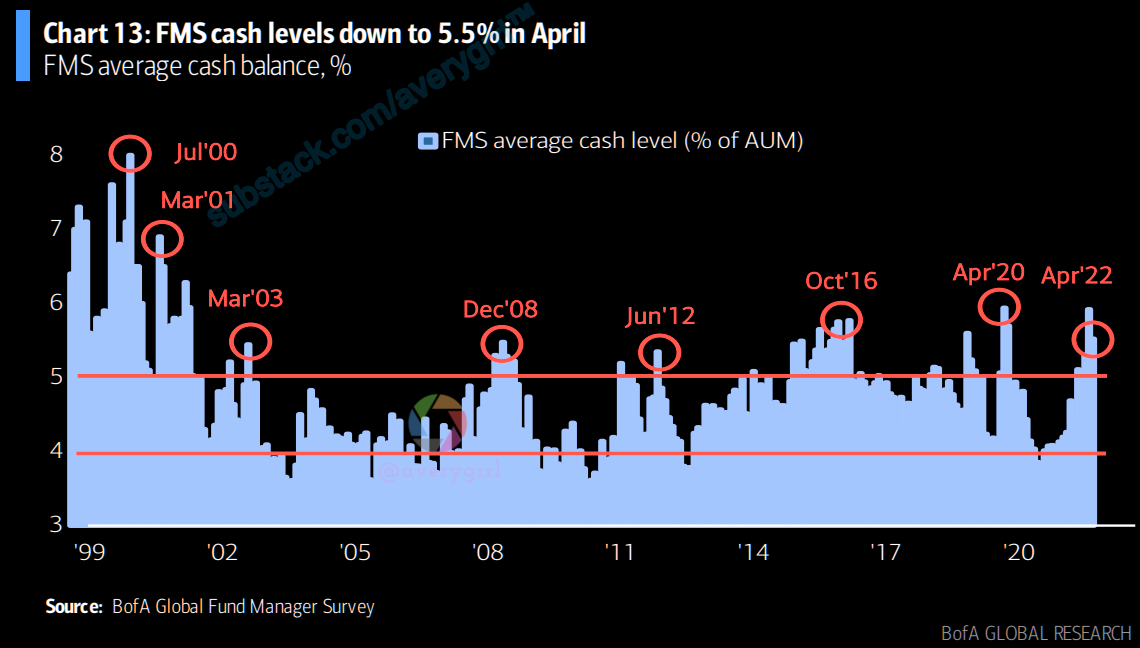
FMS cash down to 5.5% (from 5.9%) as war fears subsided. This remains a FMS Cash Rule tactical “Buy” signal…US equity return 1m +1.3%, +4.0% 3m, +6.5% 6m. BofA Bull & Bear Indicator falls to 2.0 from 2.1 (on 8wk rolling bearish sentiment from March FMS); “technically” a contrarian “buy signal”.
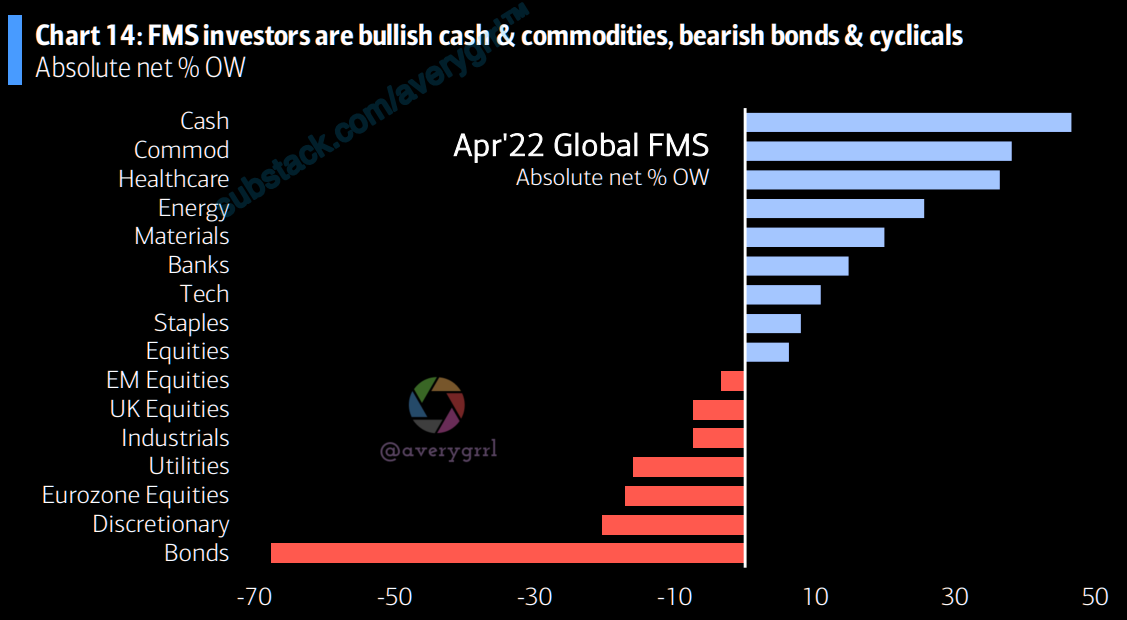
This chart shows FMS absolute investor positioning (net %). Investors are very long cash, commodities, healthcare and energy, and materials while they shun bonds, discretionary, and the EU.

This chart shows FMS investor positioning relative to the average positioning of the past 10 years. Investors are positive commodities, REITs, cash, and healthcare relative to history while at the same time very underweight the EU industrials, bonds, and EM.
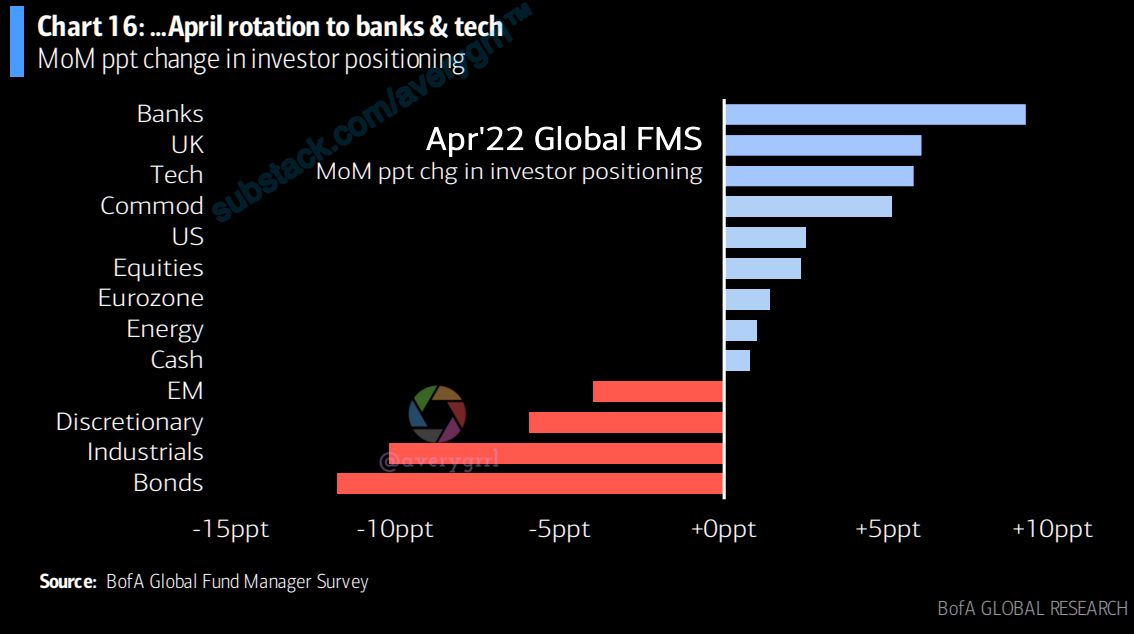
This chart shows FMS investor MoM changes in investor asset allocation. Investors have gotten more cyclical (i.e. banks, UK, tech, commodities) while at the same time cut exposure to bonds, industrials, discretionary and EM.
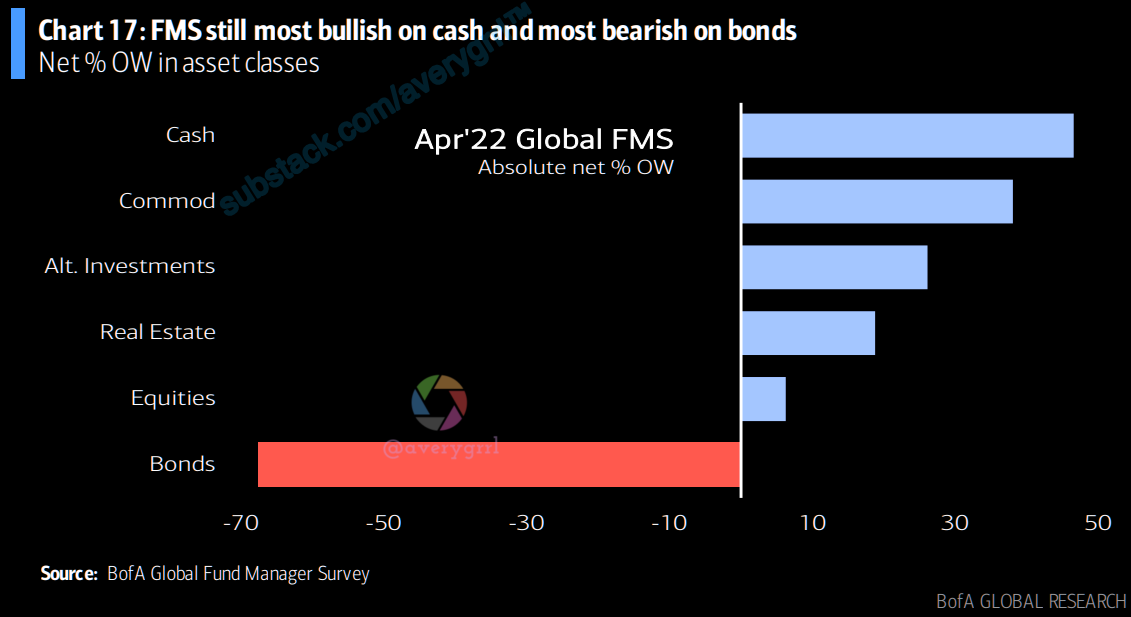
This chart shows FMS absolute investor positioning (net %) for asset classes.
Bullish: cash (net 47%), commodities (net 38%)
Bearish: bonds (net -68%)
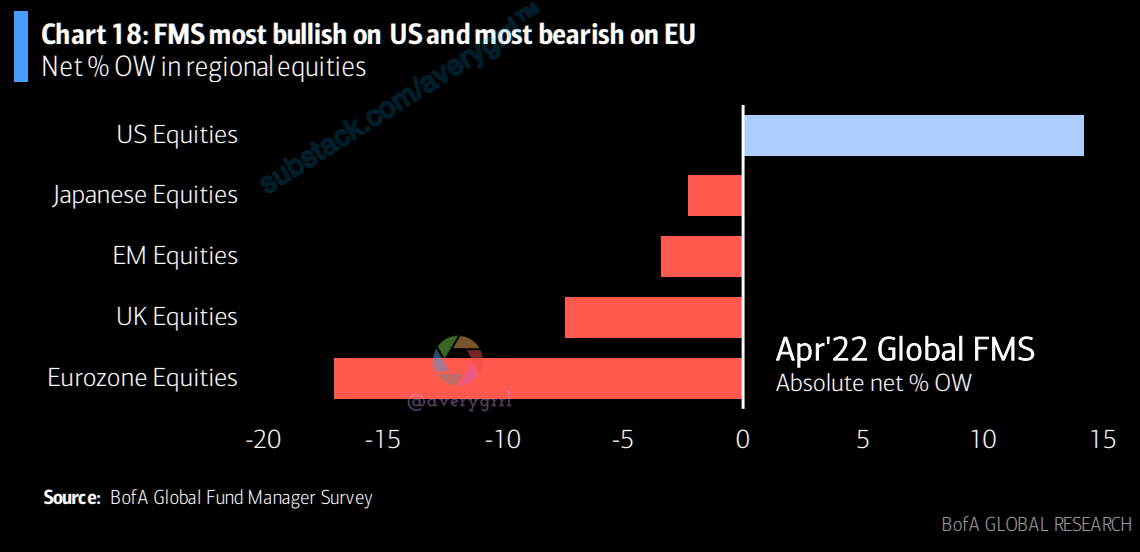
This chart shows FMS absolute investor positioning (net %) for regional equities.
Bullish: US (net 14%)
Bearish: EU (net -17%), UK (-7%)

This chart shows FMS absolute investor positioning (net %) for sectors.
Bullish: healthcare (net 36%), energy (net 26%), materials (net 20%), banks 15%
Bearish: discretionary (-15%), utilities (-16%)
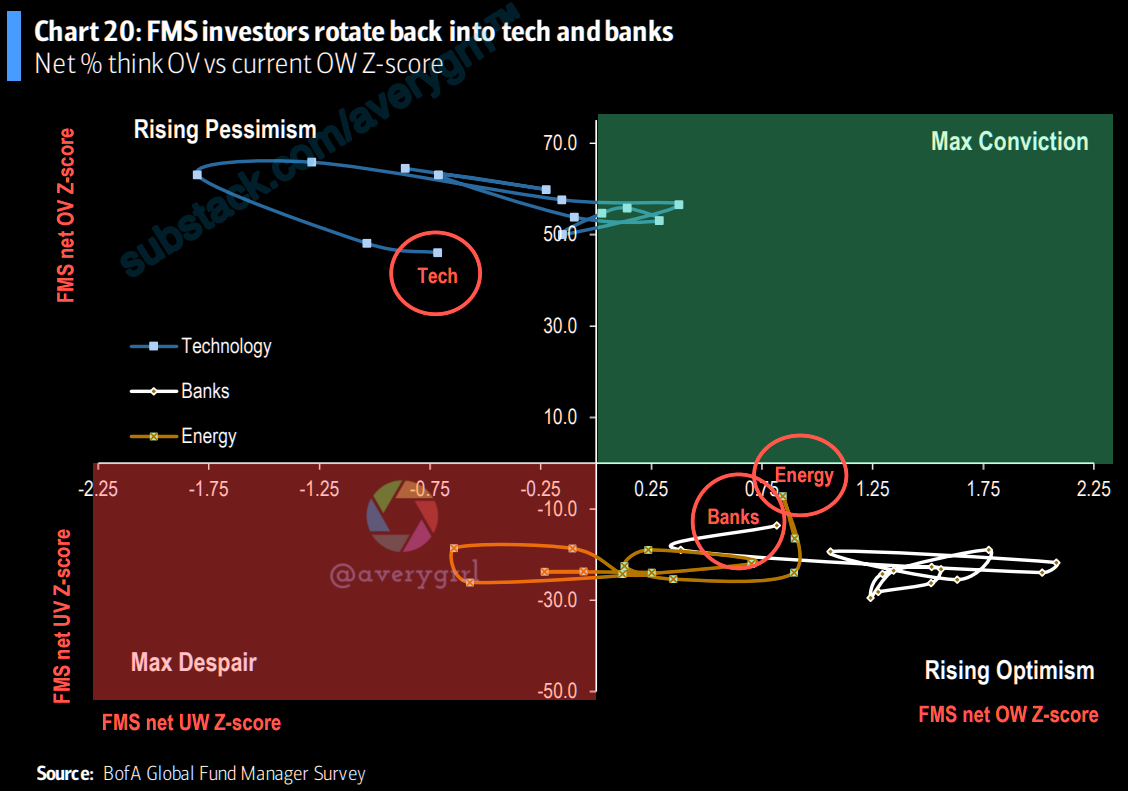
In April, FMS investors rotated back into tech and banks…
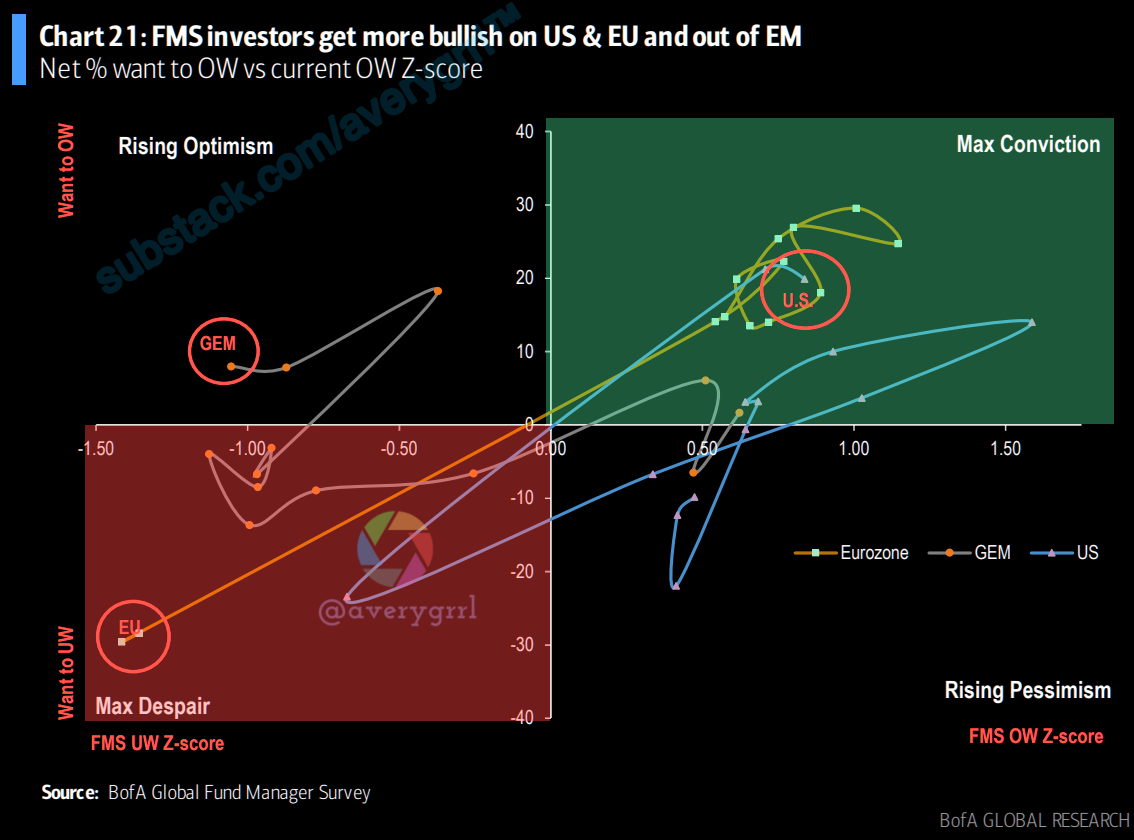
…while getting slightly more bullish on US. Investors also got more positive on EU and UK equities. How to read this chart…i.e. investors are currently still underweight EM equities on a historical basis but want to increase their exposure as well in the next 12 months.

Investors are now also the most net % OW ever for commodities at 38%...

…with oil/commodities the most crowded trade
Most crowded trades in Apr’22:
Long Oil/ Commodities (34%)
Short US Treasuries (18%)
Long Tech Stocks (16%)
Long ESG (11%)
Short China (8%)
Long Bitcoin (7%)

43% of FMS investors now think oil will produce the best returns in 2022 but only 7% think 30-year Treasury bonds and 3-month T-bills will outperform.

A majority of investors (64%) expect the S&P500 to break through the 4000 level first before breaking through the 5000 level (26%).

FMS investors believe the Fed “put” is the S&P500 falling to 3637 (was 3636).
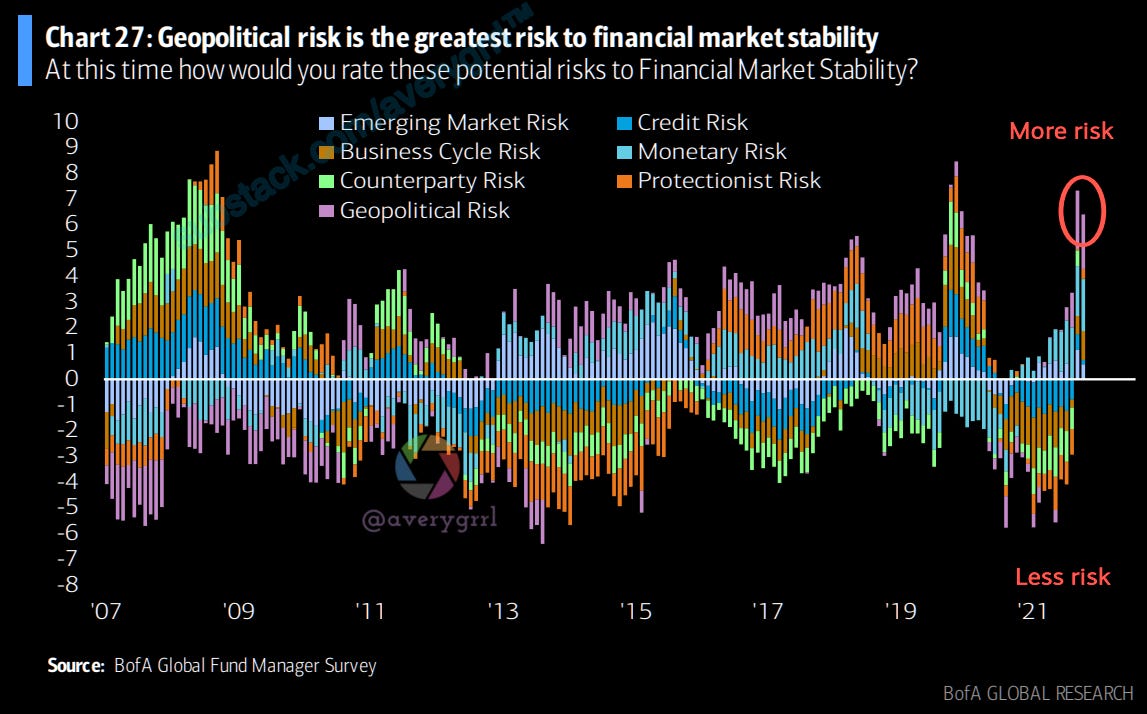
Geopolitical risk is the greatest risk to financial market stability at 92% (but is slightly down 3% from last month) followed by monetary risk at 83%, followed by business cycle risk at 71%. The chart shows the individual z-scores of each financial market stability risk since ’07.
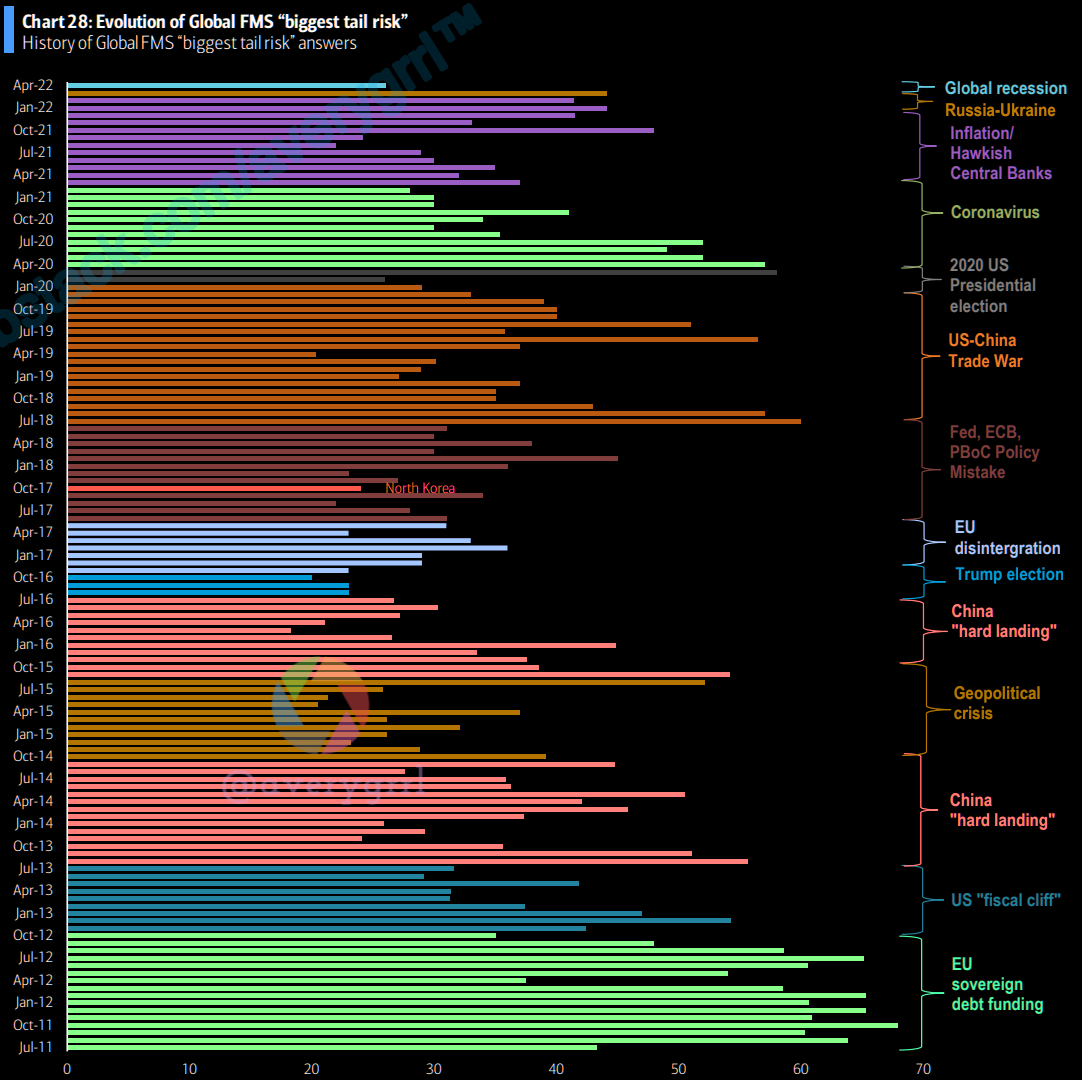
This chart shows the full history of the biggest “tail risk” for markets from BofA’s monthly Global Fund Manager Survey.
The dominant concerns of investors since 2011 have been Eurozone debt & potential breakdown; Chinese growth; populism, quantitative tightening & trade wars, global coronavirus; now inflation/bond tantrum and central bank rate hikes.
Global recession is top “tail risk” at 26% of FMS investors; #2 Hawkish central banks, #3 Inflation, #4 Russia-Ukraine conflict.
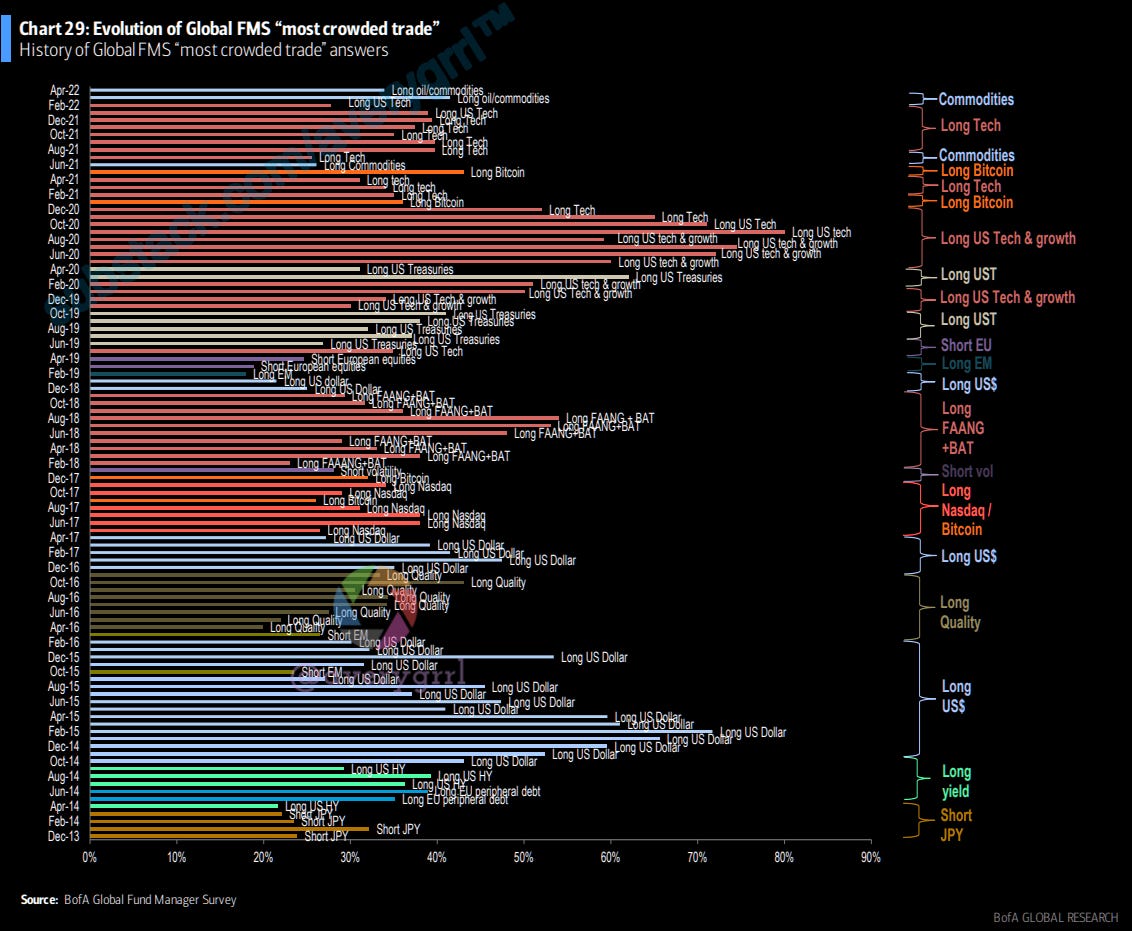
This chart shows the full history of the most “crowded trade” according to BofA’s monthly Global Fund Manager Survey.
The market leadership has been relatively narrow since 2013, shifting from high yielding debt; long US$; long Quality; long Tech; long Emerging Markets; long US Treasuries, long US tech & growth stocks, long Bitcoin, long commodities, long tech.
Long oil/commodities is top with 34% of FMS investors saying it is the most “crowded trade”; #2 Short US Treasuries, #3 Long US tech stocks, #4 Long ESG.
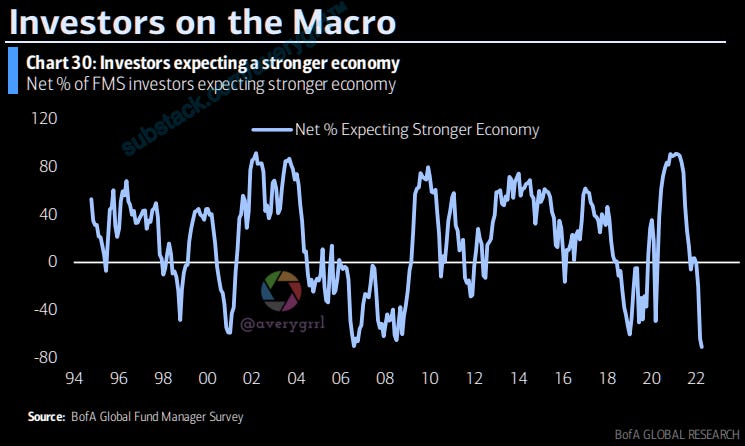
April FMS showed a 7ppt MoM decrease to net 71% of FMS expecting a weaker economy in next 12 months, the lowest growth expectations ever (back to ’95).
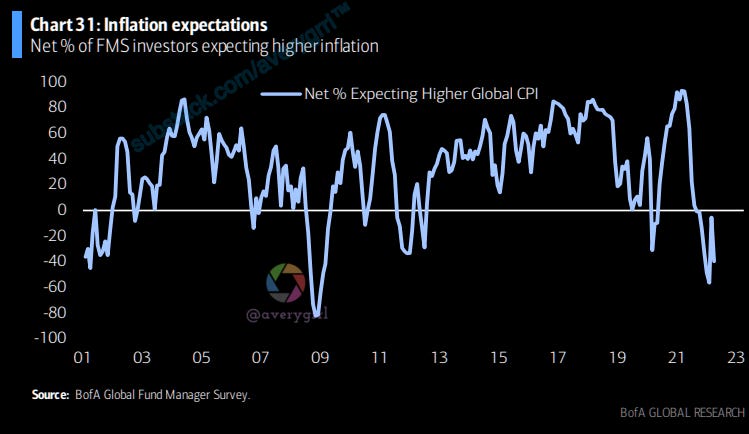
FMS investors expecting lower global CPI in the next 12 months rose 35ppt MoM to net 40%.
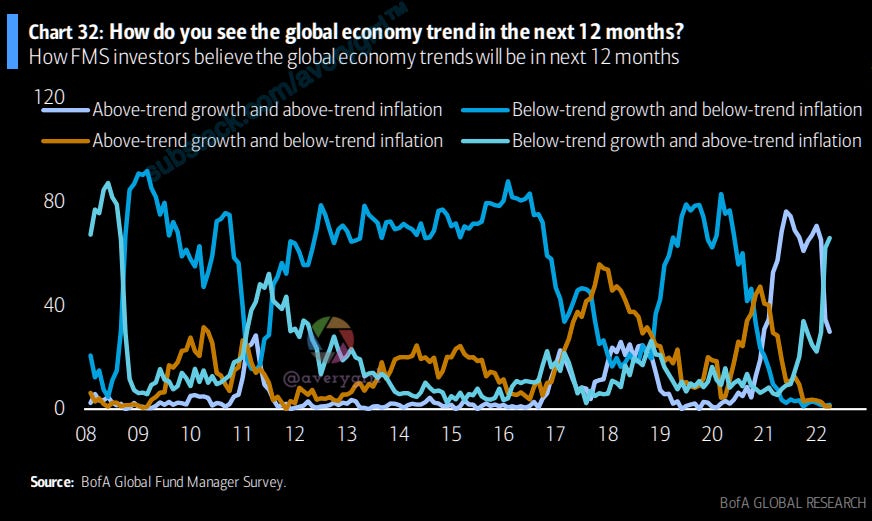
“Stagflation” expectations (below-trend growth and above-trend inflation) up from 62% to 66%, highest since Aug’08. “Boom” expectations down from 35% to 30%, lowest since Dec’20. “Goldilocks” expectations flat at 1%, while “Recession” expectations up from 1% to 2%

Net 35% of FMS investors say they are currently taking lower-than-normal risk levels, down 6ppt MoM

Net 67% expect high dividend yield to beat low dividend yield, up 8ppt MoM and the highest since Jul’16. Net 76% expect high quality earnings to outperform low quality earnings, flat MoM and the highest since Apr’20. Net 44% expect low volatility to outperform high volatility, up 2ppt MoM and the highest since Feb’16.
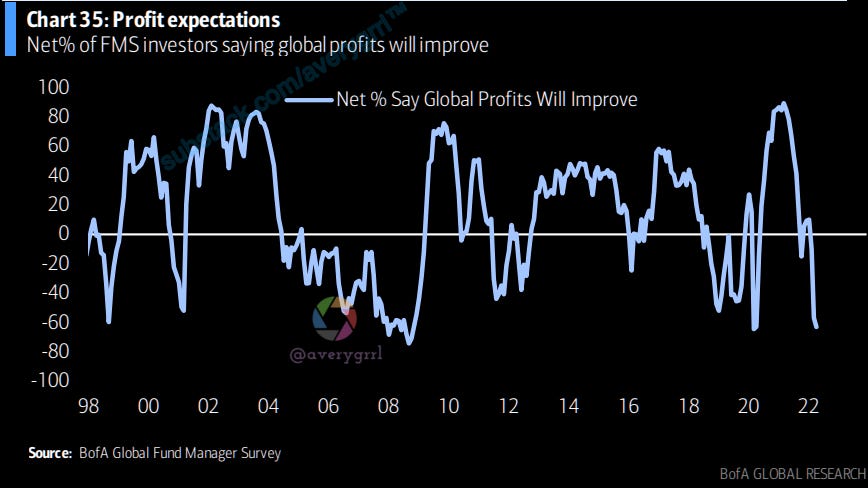
FMS investors expecting global profits to worsen over the next 12 months fell a net 6ppt MoM to net 63%, the most since Mar’20.
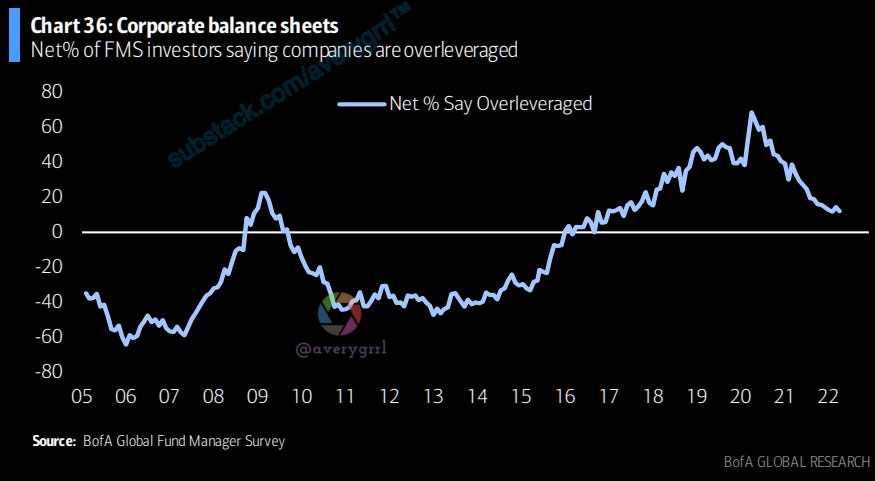
The net percentage of FMS investors saying companies are overleveraged declined 2ppt MoM to net 12%.

The net percentage of respondents who advocate for returning cash to shareholders remained flat at net 20ppt. Net 39% of FMS investors want corporates to spend cash on increasing capital spending (down 1ppt MoM), improve balance sheets up 3ppt MoM to 34%.
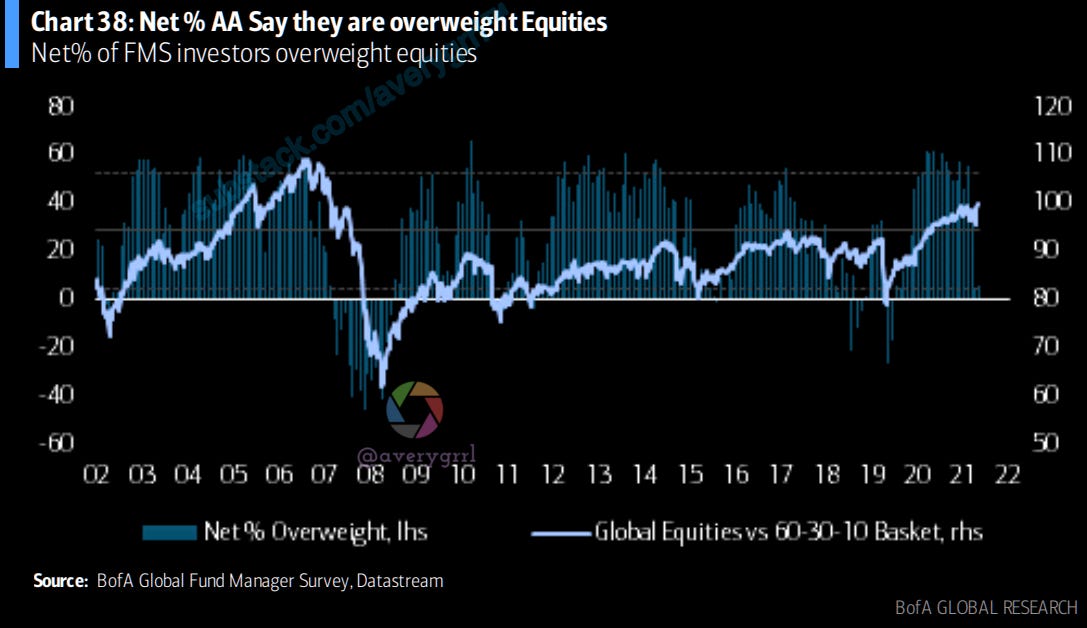
FMS equity allocation increased 2ppt MoM to net 6% overweight this month. Current allocation is 0.9 stdev below its long-term average.

FMS investors’ bond allocation declined 12ppt MoM to net 68% underweight. Current allocation is 1.2 stdev below its long-term average.
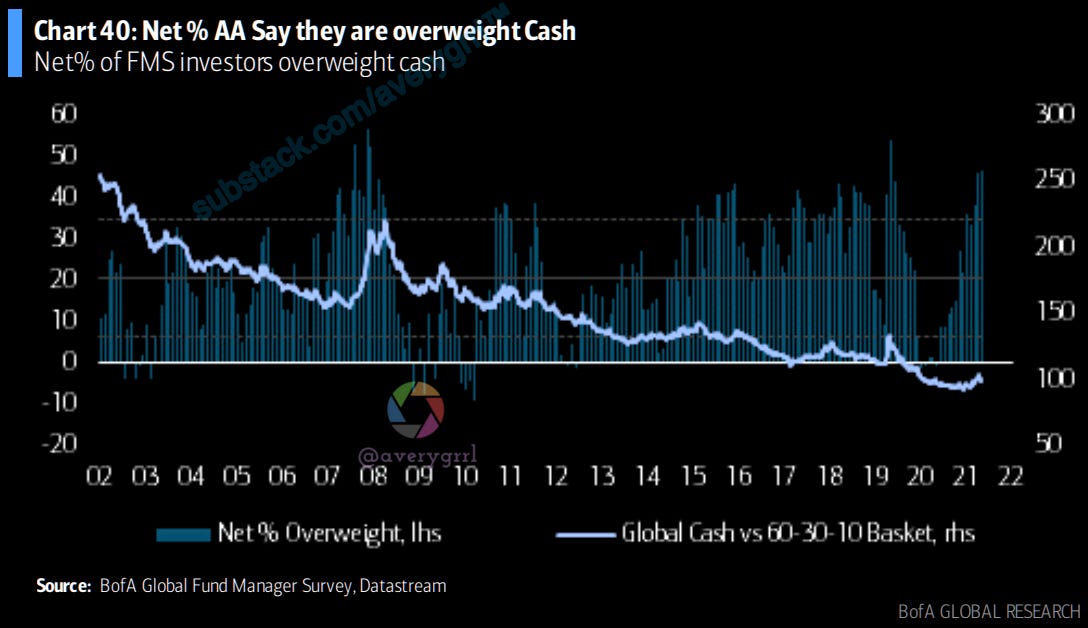
FMS cash allocation increased 1ppt MoM to net 47% overweight, the highest since Apr’20. Current allocation is 1.9 stdev above its long-term average.
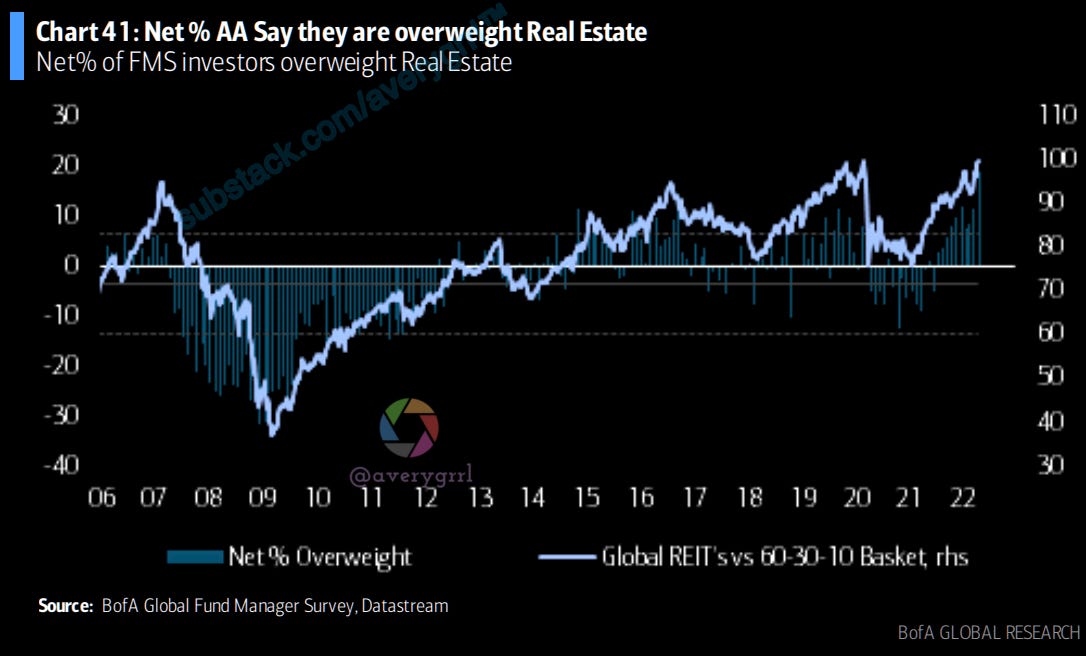
Allocation to real estate steady increased 7ppt MoM to net 19% overweight, a record high (back to ‘06). Current allocation is 2.2 stdev above its long-term average.
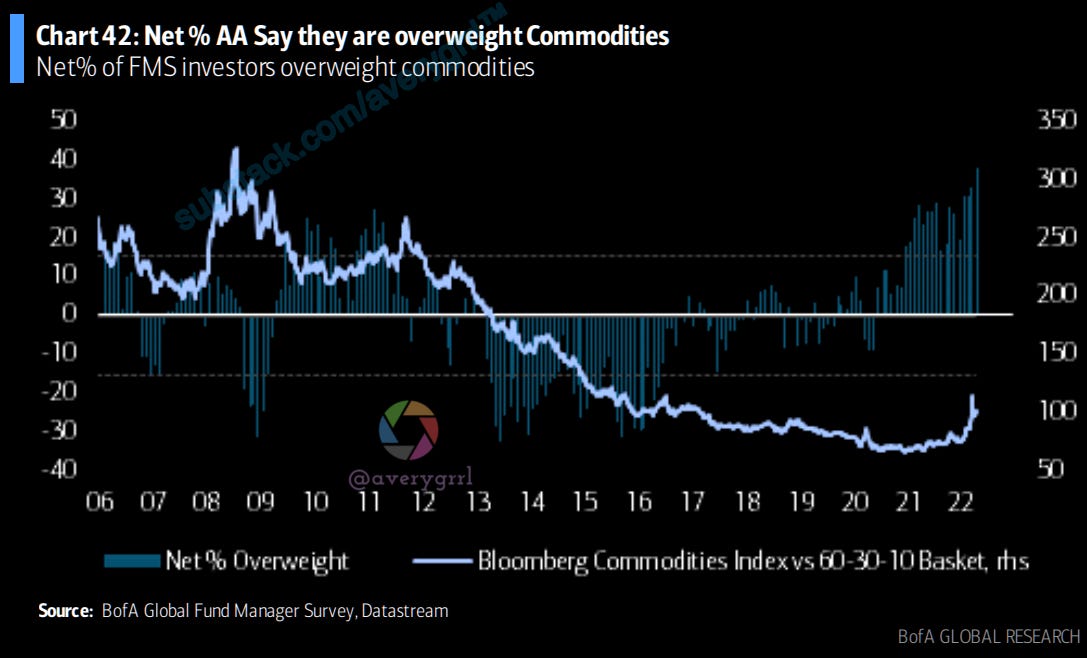
Allocation to commodities increased 5ppt MoM to net 38% overweight, the highest ever. Current allocation is 2.4 stdev above its long-term average.
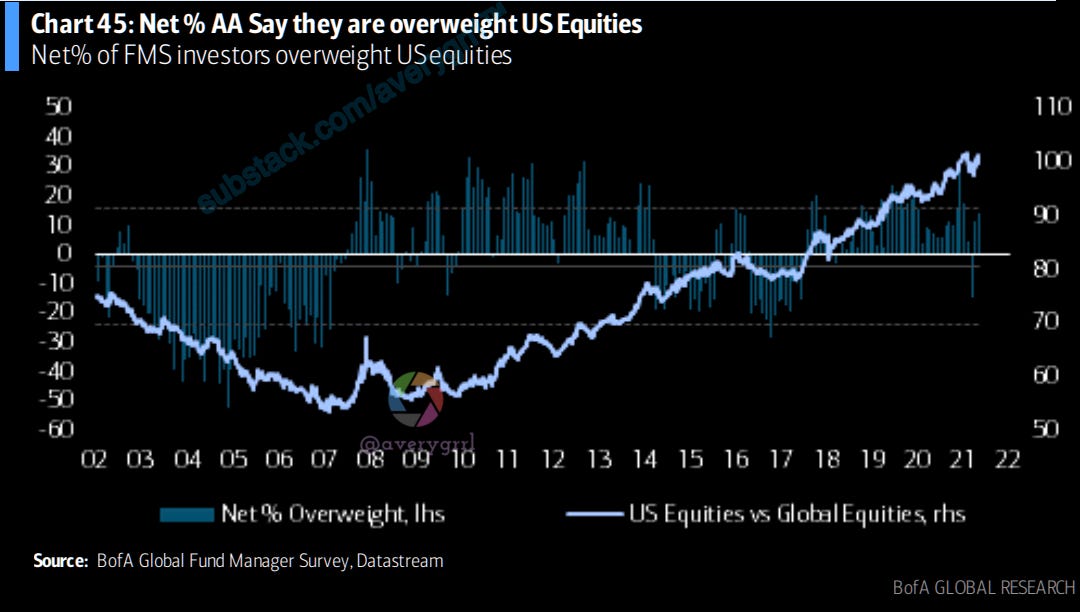
Allocation to US equities increased 2ppt MoM to 14% overweight, the highest since Dec’21. Current allocation is 0.8 stdev above its long-term average.
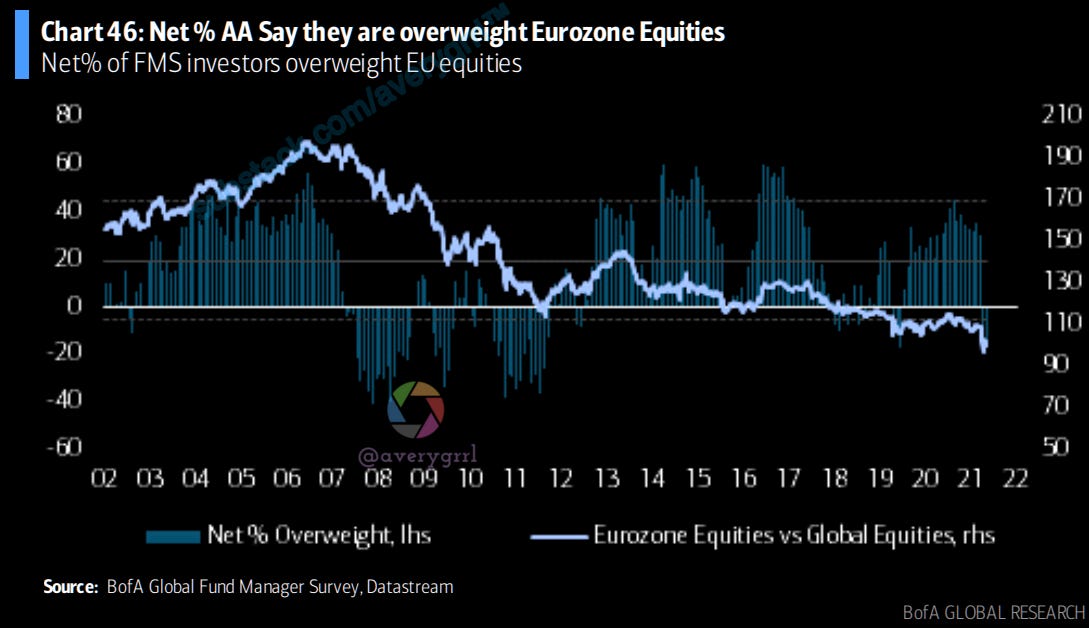
Allocation to Eurozone increased 1ppt MoM to net 17% underweight. Current allocation is 1.4 stdev below its longterm average.

Allocation to EM equities decreased 4ppt MoM to net 3% underweight, the most underweight since Oct’21. Current allocation is 1.1 stdev below its long-term average.
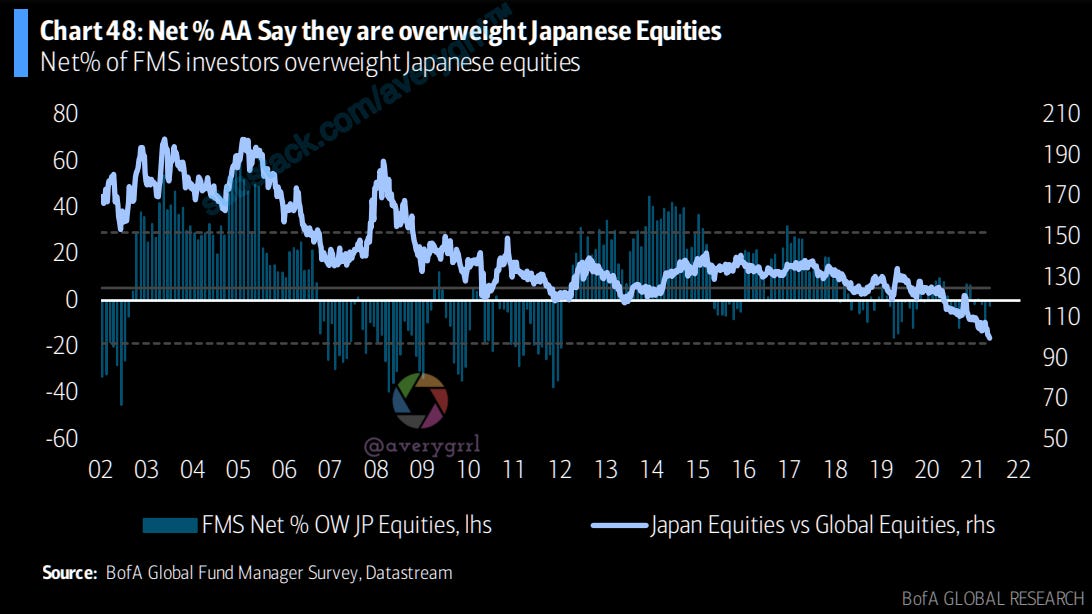
FMS allocation to Japanese equities increased 6ppt MoM to net 2% underweight. Current allocation is 0.3 stdev below its long-term average.
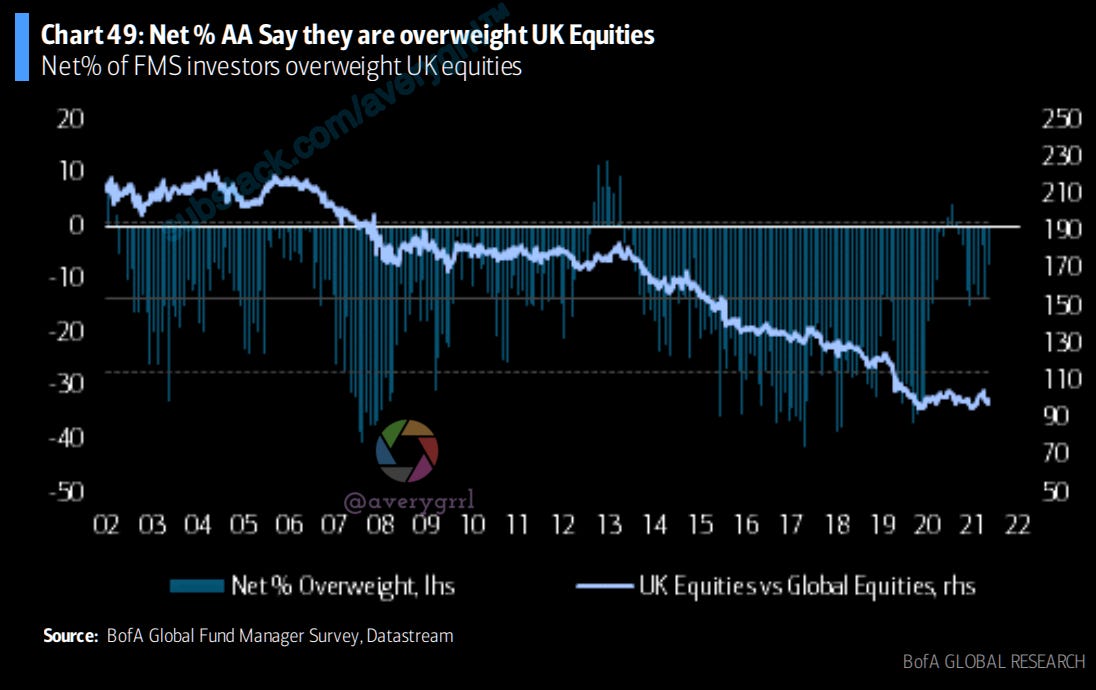
FMS allocation to UK equities increased 6ppt MoM to 7% underweight. Current allocation is 0.6 stdev above its long-term average.

FMS allocation to UK equities increased 6ppt MoM to 7% underweight. Current allocation is 0.6 stdev above its long-term average.
—Avery
Thanks for reading my screaming captions. 💕