Growth Outlook and Income Troubles?
Growth Outlook and Income Troubles?
The Outlook on Growth; Pessimism Rises as Real Wages Fall

First, a quick look at growth outlooks, and then a comprehensive rundown on consumer spending for signs of income troubles.
Everything here is free. If you enjoy my work, please consider tipping. Thanks!
Fundamentals vs. Sentiment/Technicals
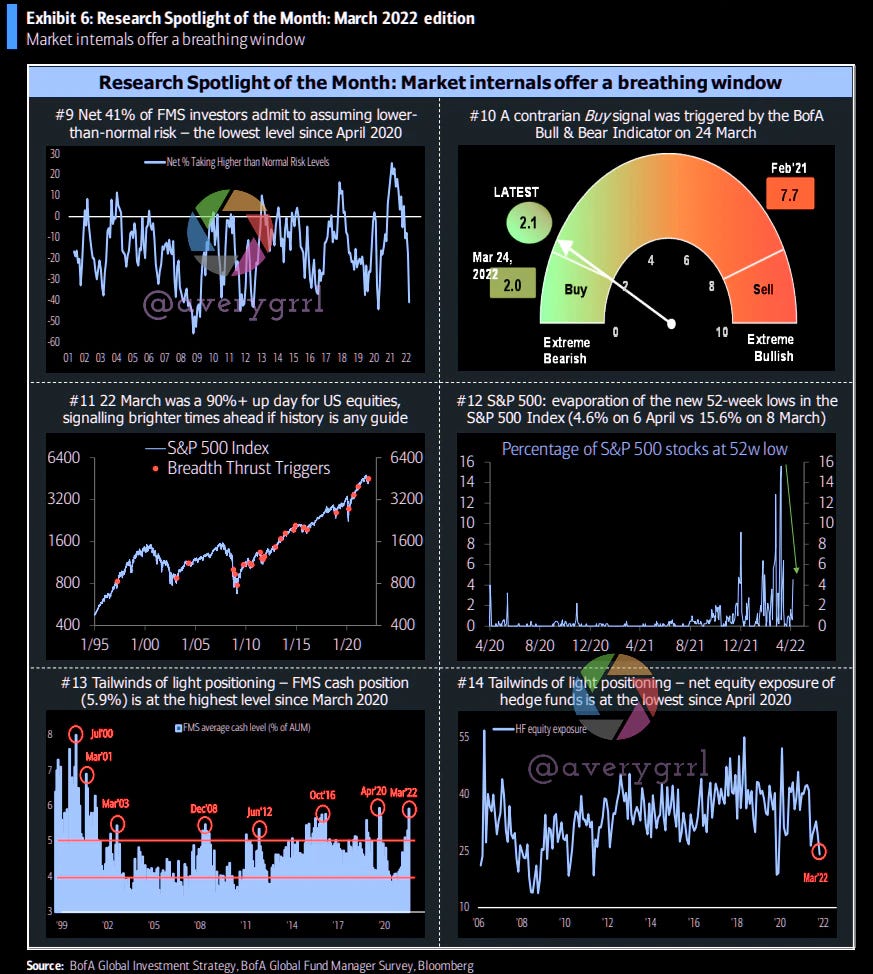
Capital market investors have been confounded by the bounce off the lows in global equities despite the fusillade of sobering news on war, growth, policy, and inflation. The triggering of key market technical signals in a backdrop of oversold sentiment kindles a veneer of hope, but any upside potential will likely be capped by the unfavorable macroeconomic environment of slowing growth, rising inflation, and tightening policy. A quality bias appears to be the prudent approach.
Growth: Expanding but the outlook is dimming
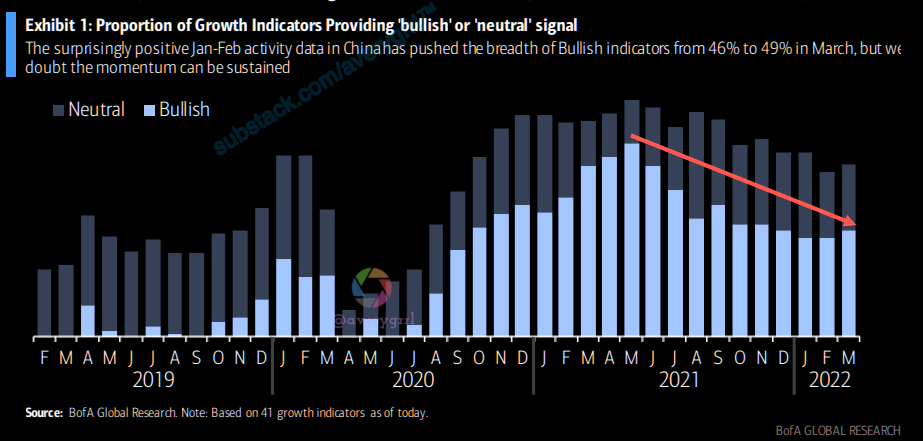
The majority (73%) of BofA’s 41 growth indicators are flagging a bullish or neutral signal, but outright bullish signals have retreated from their 81% high in May 2021 to 49% today, along with a crawl up in bearish signals from 3% in May 2021 to 27% now.
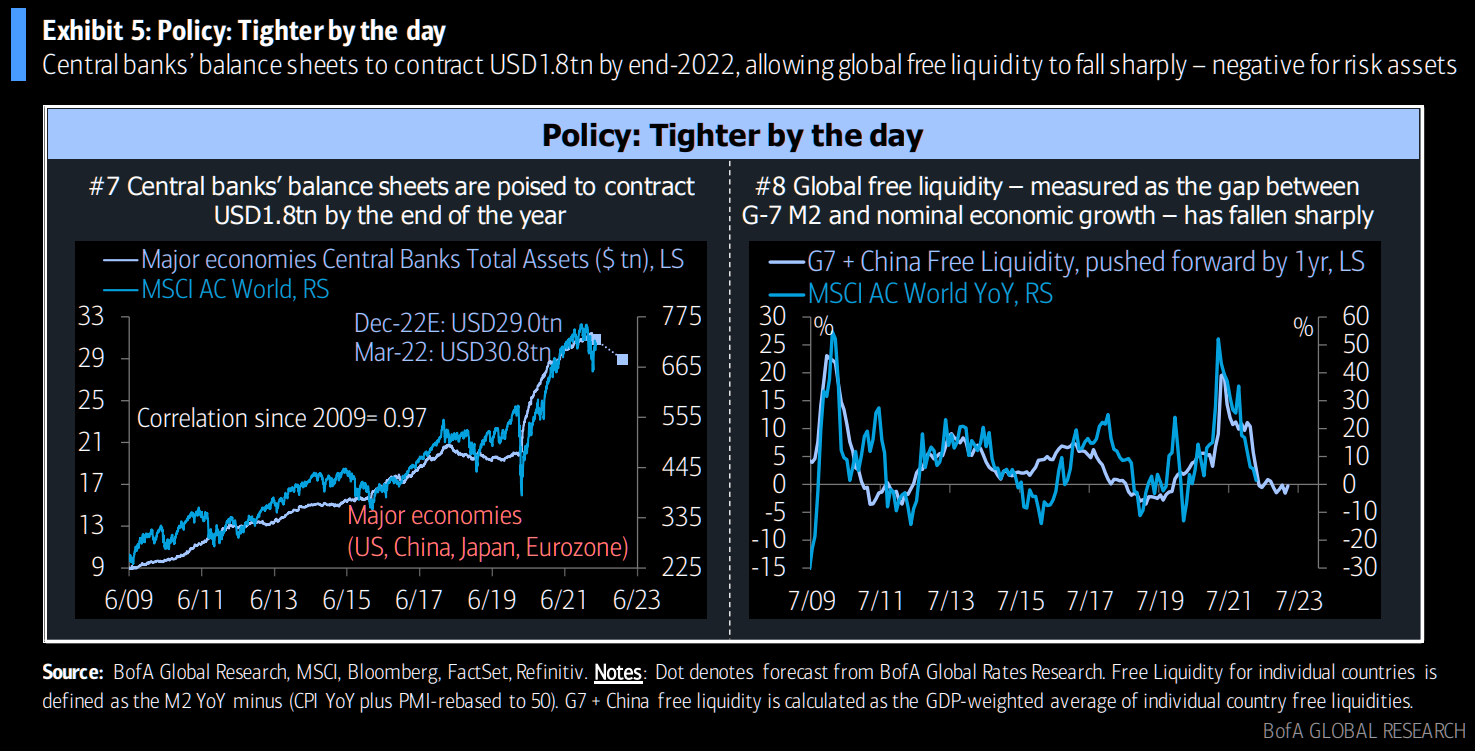
While a potential truce in the Russia-Ukraine crisis could provide some respite, the prior stance of central banks (22 out of 34 global central banks are in a tightening mode now vs 10 at the end of September 2021), which tends to lead the global business cycle, makes us believe that this downward drift in the global growth trajectory is unlikely to abate anytime soon.
Summary: Compensation is down in real terms. There is extreme pessimism in sentiment/positioning. Coupled with the positive impulse from market internals, this suggests the market may test new highs but the subdued fundamentals will be a limiting factor in how far equities can run. A quality bias appears to be the sensible approach assuming that the Fed can engineer a soft landing,


Chinese Activity Slows
The BofA China Activity Coincident Tracker unexpectedly turned positive in January-February after dwindling down for close to a year, but we doubt the momentum can be sustained given stiff headwinds from COVID-19 resurgence, weak credit demand, property market headwind and regulatory scrutiny. The lockdowns of key economic hubs such as Shanghai (3.8% of China GDP) and Shenzhen (2.7% of China GDP) in pursuit of the “COVID Zero” strategy has hurt services, factory production and supply chains at a time when geopolitical conflicts are cutting external demand. Nationwide mobility is falling sharply, property sales are dropping sharply (-53% YoY in March for the top 100 developers) and box office collections tanking. The March PMI data offers a preview: NBS manufacturing PMI fell from 50.2 in February to 49.5 in March (below consensus forecast of 49.8) and non-manufacturing PMI from 51.6 to 48.4 (below consensus forecast of 50.3).
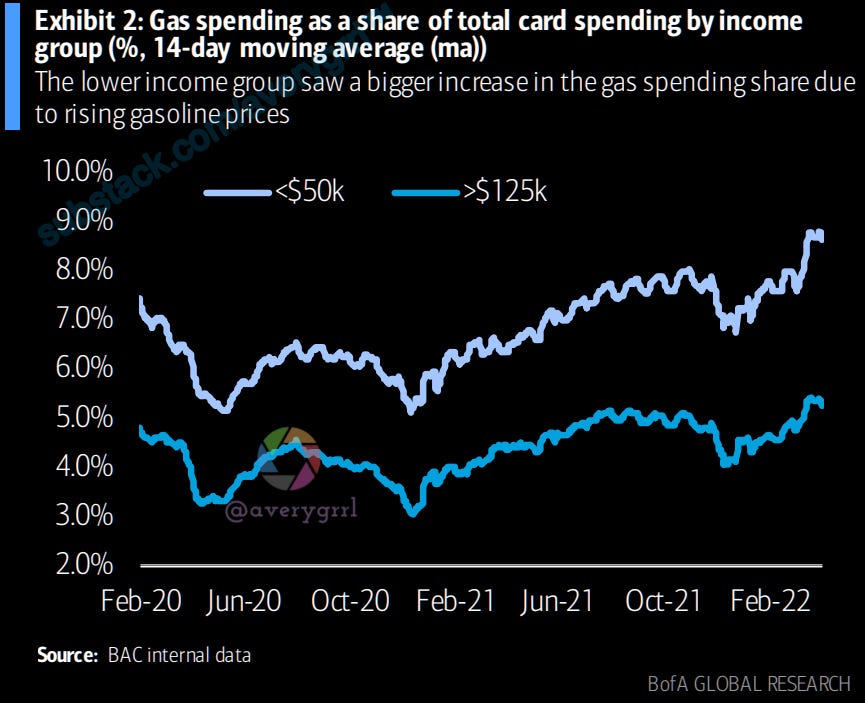
The Energy Shock Continues
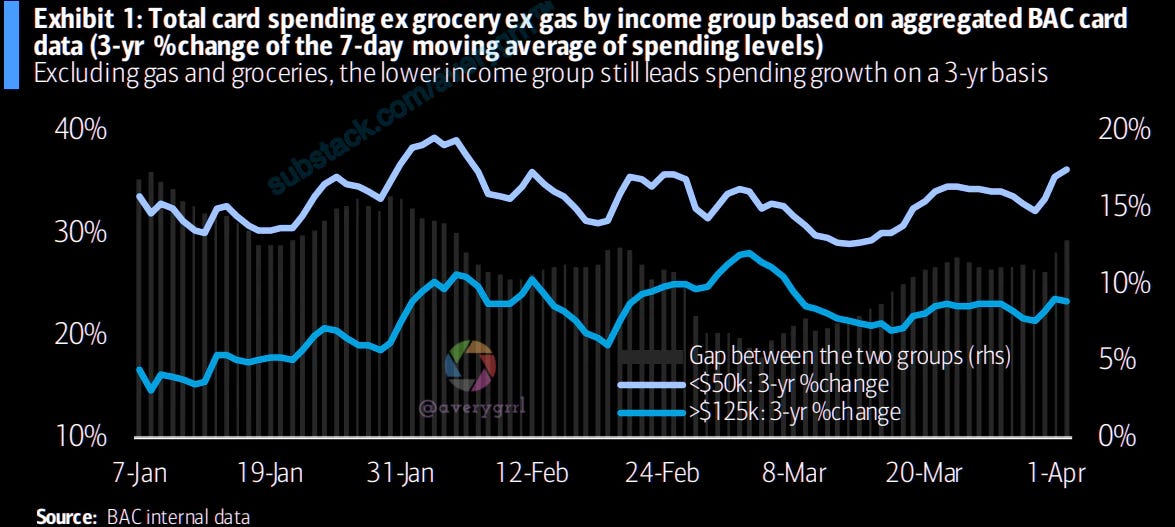
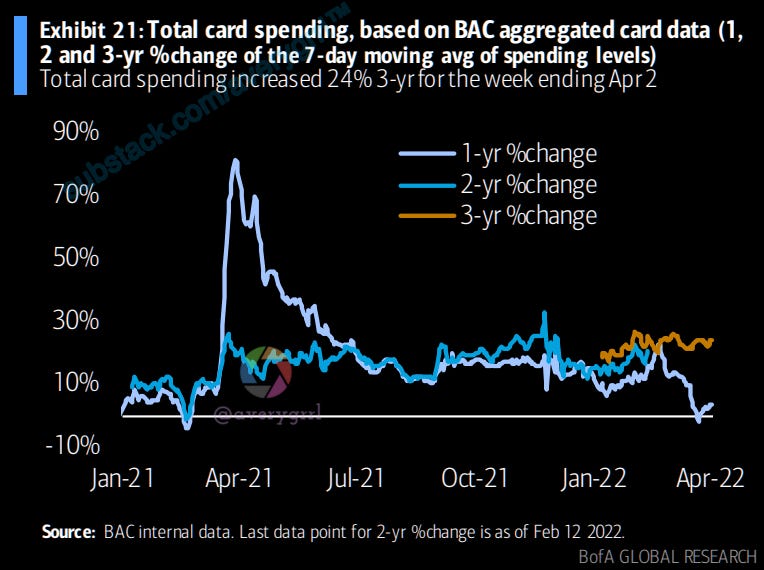
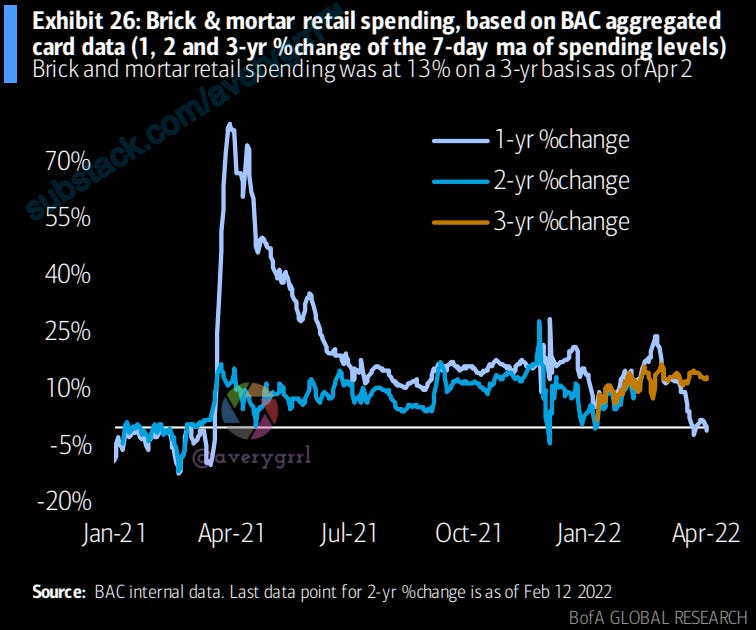
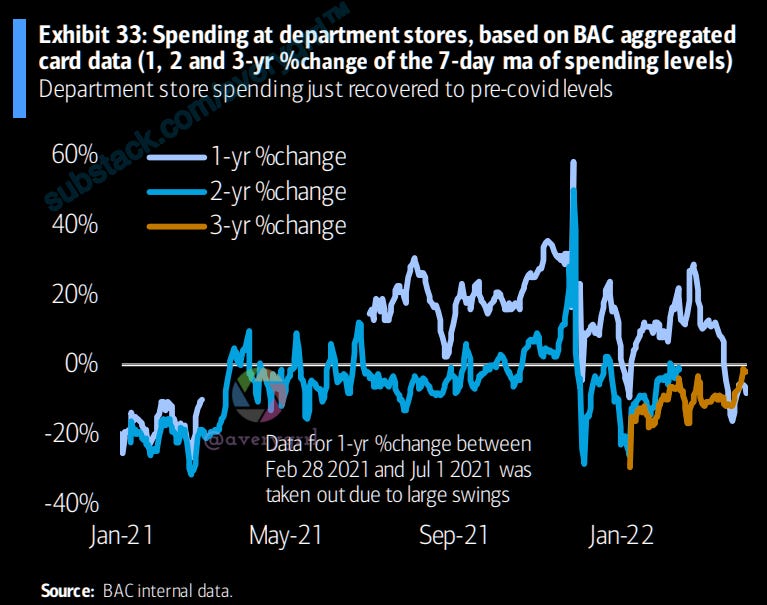
Card spending increased by an average rate of 23.2% on a 3-year basis in March. This was approximately in-line with the average growth rate of 23.6% (3-year) in February. The YoY rate slowed sharply in March, but I believe this was distorted by the stimulus payments in 2021.
Card Spending Data Is Here; All of It
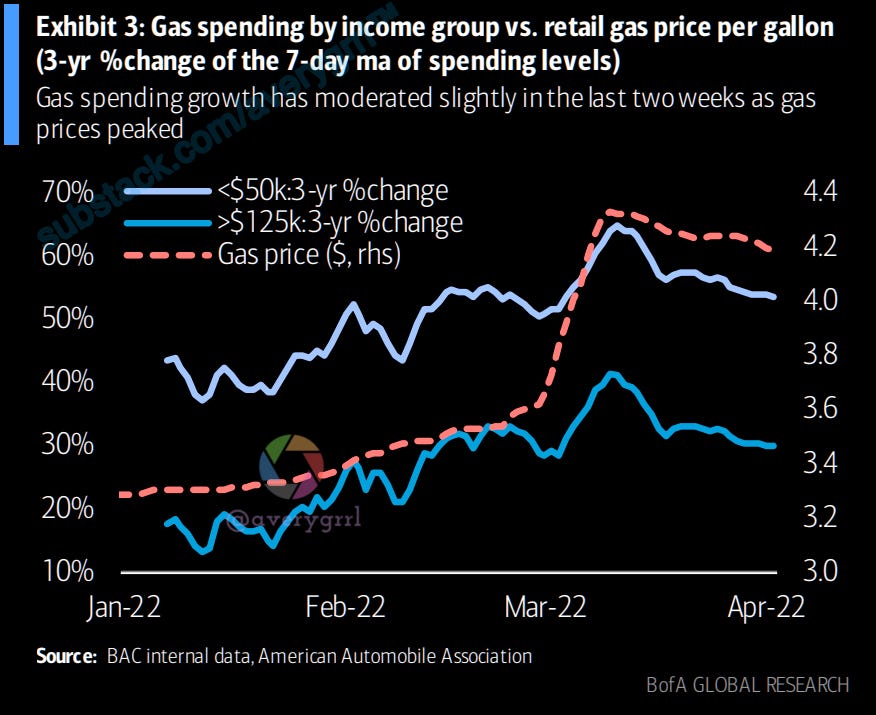

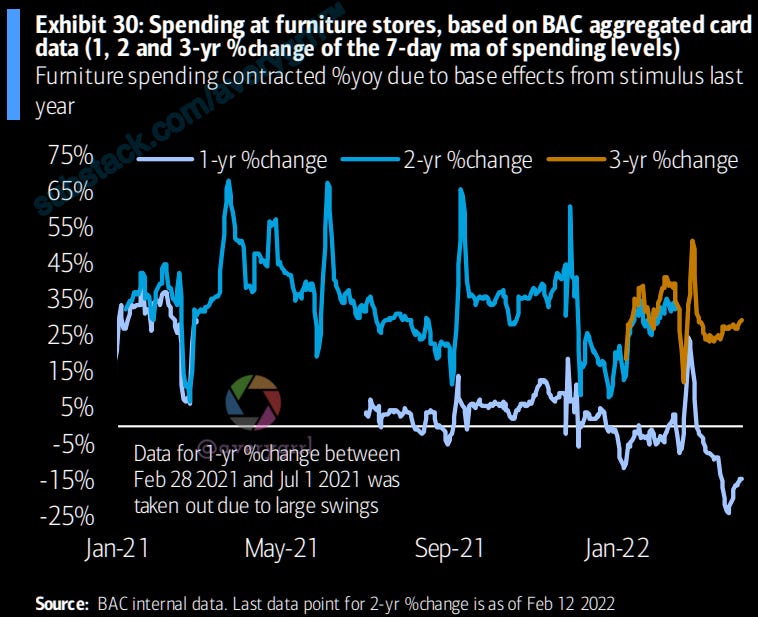
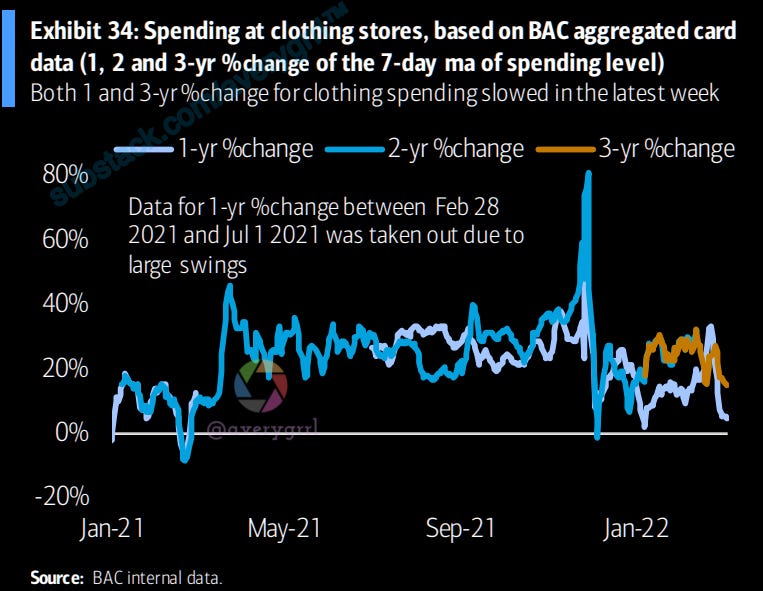
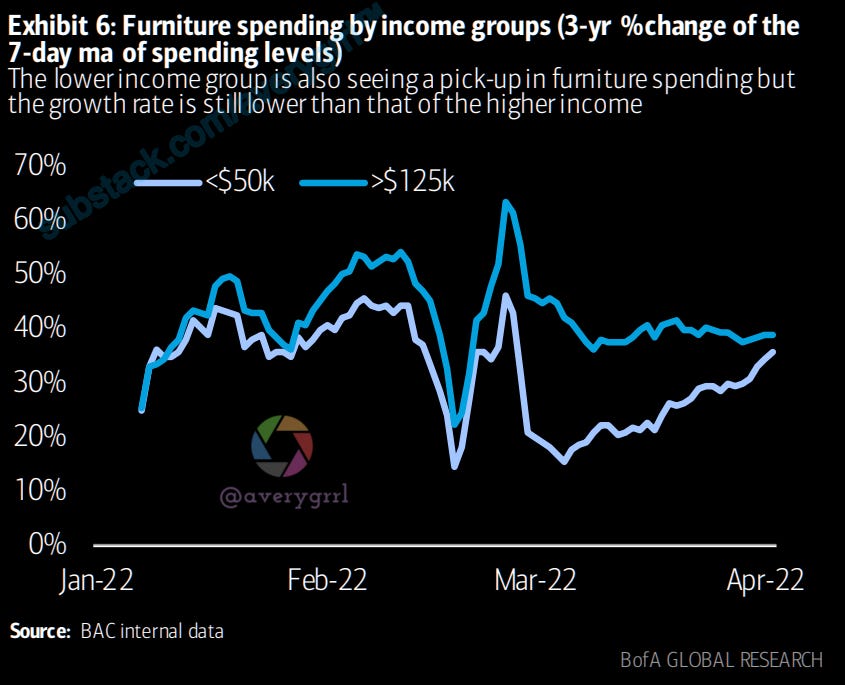
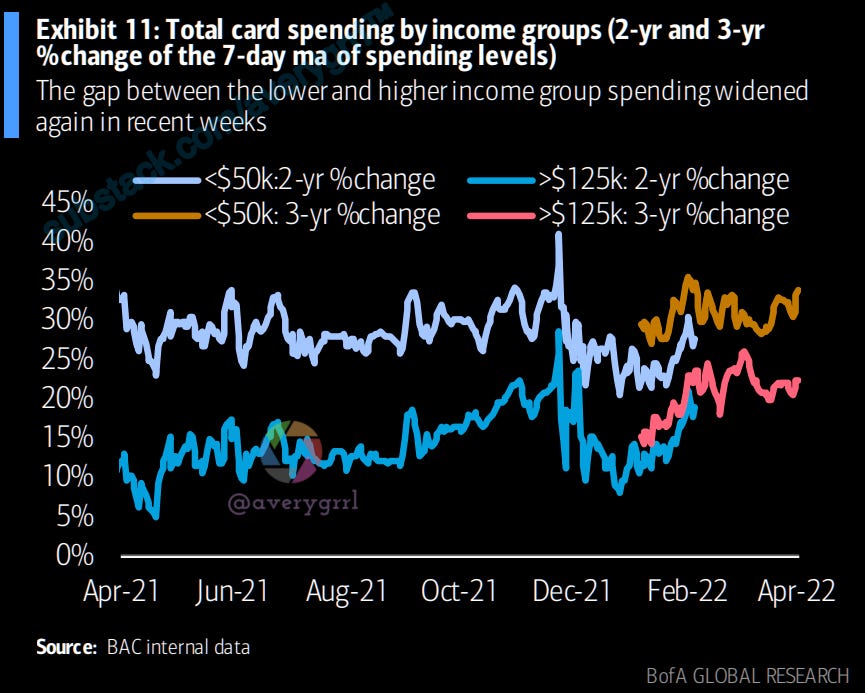
There has been evidence of weakening clothing and furniture spending for the lower income group due to surging gas prices. Recent data suggest the gas shock impact might be more muted. After slowing noticeably for the first two weeks of March, clothing spending rebounded again for lower incomes on a 3-year basis, although still lower than the growth rate this January.

Furniture spending also saw a similar pattern. The lower income group also continues to lead spending growth across all major sectors
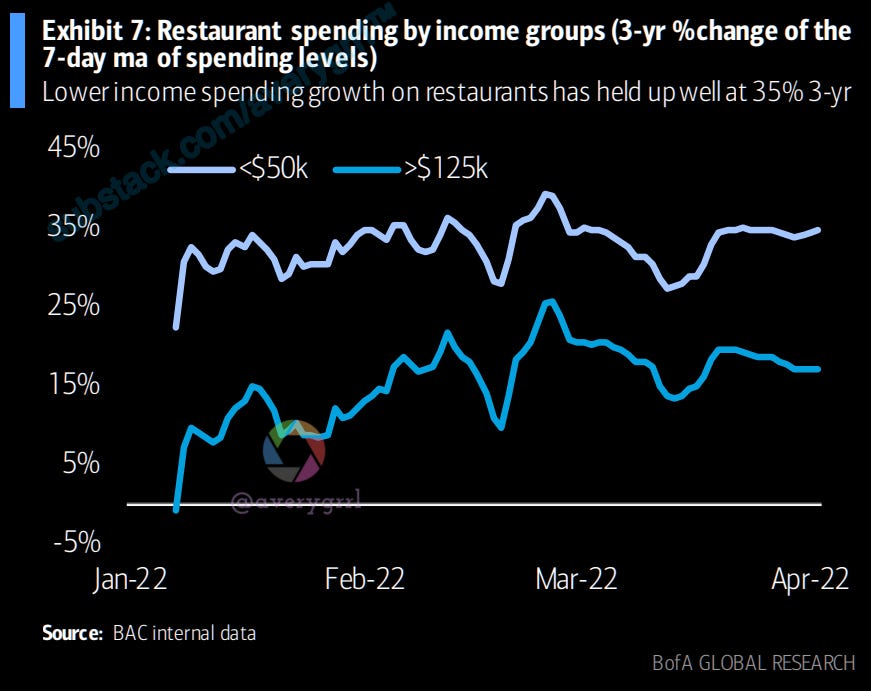
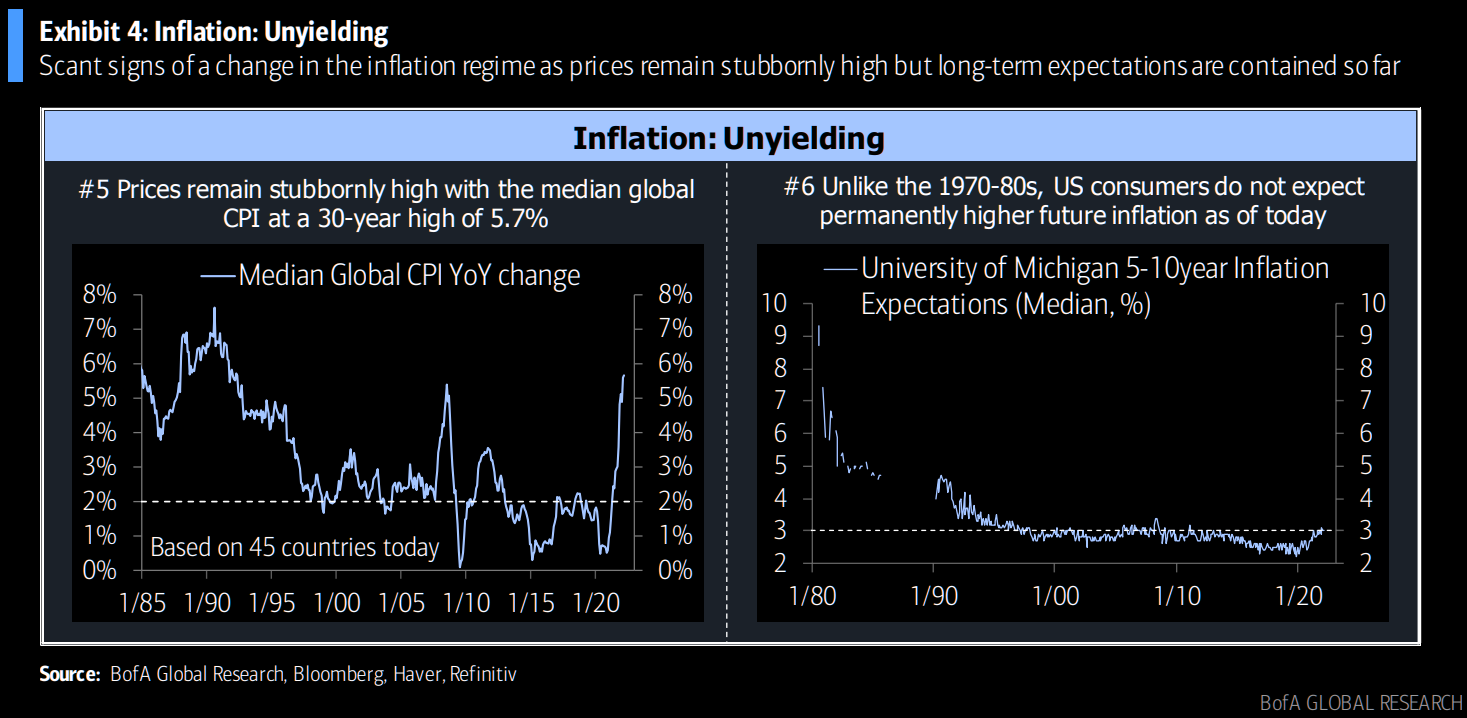
Interestingly, the rebound in spending for the higher income has been slower than expected. This coincides with the recent drop in the University of Michigan consumer sentiment, which was almost entirely driven by the top third income group.
Regional differences: total card spending excluding gas in states with high oil production (TX/OK/KS/ND/SD) exceeded the rest of the country for the week ending April 2 while total card spending ex-gas in states with the highest gas prices (CA/WA/OR/NV/HI) is lagging.


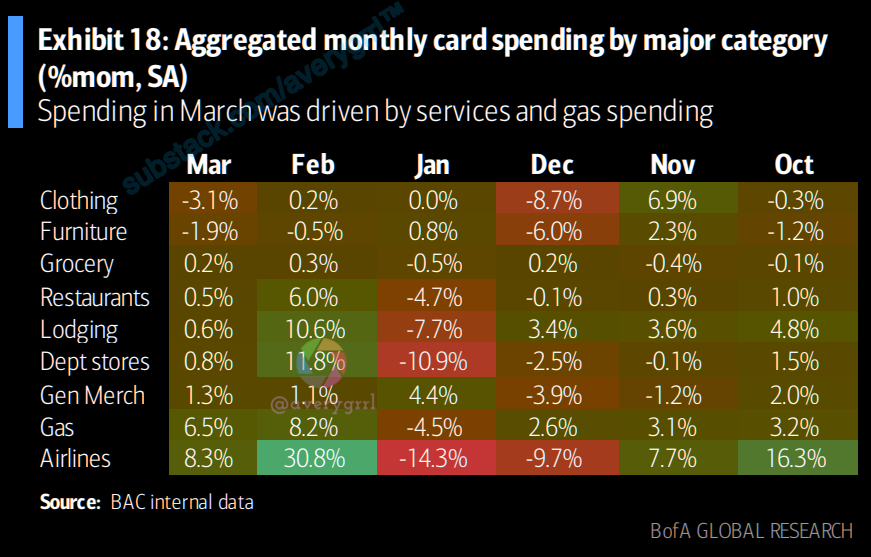
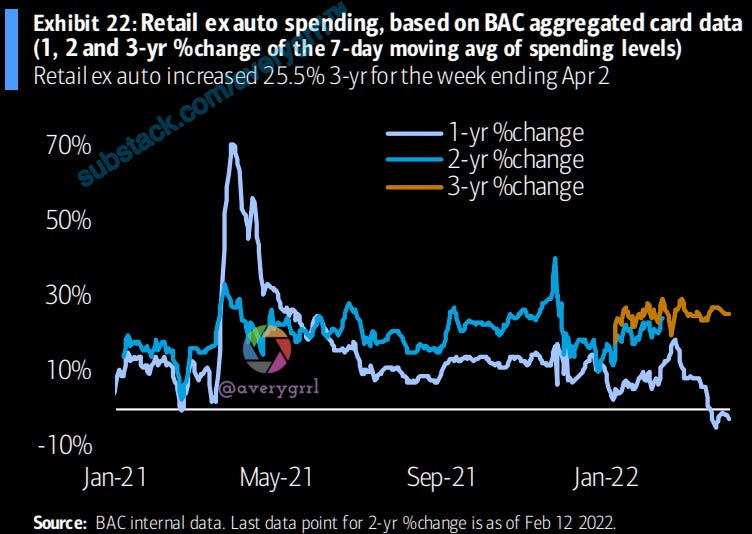
Retail sales ex autos, based on the aggregated BAC card data, increased by 0.9% month-over-month (mom) seasonally adjusted (SA) in March. Netting out gas spending, which jumped by 6.5% mom due to surging prices, retail ex auto ex gas showed a more tepid growth of 0.2%. Mar headline retail sales should increase by 0.5% mom as strong gas spending offset weakness in autos